

OIST Wave Energy Project
Seragaki Monitor and Live Camera JMA Tide Height at Naha NAUFAS at Naha
Maldives WEC Monitor Display Maldives Camera
Abstract
Our Wave Energy Converter (WEC) is based on a new working principle, which uses small size turbine in breaking wave, originally created at OIST in 2014. The hardware R&D, which we now refer to as the OIST Wave Energy Project Phase-I, was started in 2016[1,2]. Two half-scale WECs (35 cm turbine, 1.3 kW peak) were installed at the eastside beach of Kandooma Island in the Maldives in May 2018, and have accumulated over 7,200 hours (ten months) of continuous operation at the time of writing (February 2019). Another two full-scale WECs (60 cm turbine, 8 kW peak) were installed in November 2018, and have accumulated over 2000 hours (three months) of operation. Recently, we have tested 1st prototype model of Ducted-WEC (taper waveguide and ducted turbine), and obtained roughly six times higher power than bare turbine. In this paper, we report experience and results from field tests in the Maldives.
Introduction
OIST Wave Energy Project uses an array of small turbines standing on the sea floor, in shallow water near 1 m depth, as illustrated in Fig. 1, where the forward-running water in the breaking wave drives the turbine and generates electricity. Key features of our WECs are:
- The running speed of water inside the breaking wave is much higher than the swells at deep-sea area. Therefore, we may use small size turbines.
- A fundamental limitation of this design is its low power conversion efficiency due to highly convex flow of breaking wave. A part of the Phase-I R&D was the evaluation of this problem by CFD simulation and also experimental measurements. In Phase-II R&D, we will introduce Ducted-WEC concept, which guides the water flow into a tapered waveguide (four surrounding Neumann boundary condition, i.e., slippy wall), and there is no free water-surface on top. Therefore the wave does not break anymore, and forms a parallel flow into the turbine at the end.
- Another fundamental limitation of such a scheme would be the impulse power generation due to dynamic wave-breaking phenomena. Thanks to the today's advancing technology in the solid-state power conversion circuitry and energy storage, we may overcome the limitation, i.e., we can temporarily store the generated electricity in a capacitor bank, followed by sending the regulated power into the AC-grid system with highly stabilized frequency and voltage.
- Small and simple WEC design will be suitable for the mass-production process in industry, and thus the production cost will become much lower. We will use aluminium alloy and die-cast method in the mass production, which drastically drops the fabrication cost. For example, the price of the turbine of 60 cm diameter should be around 1000 $/piece, considering that the price of a typical car alloy wheel is around 500 to 1000 $/pieces (turbines will be fabricated in the same industry as car alloy wheels).
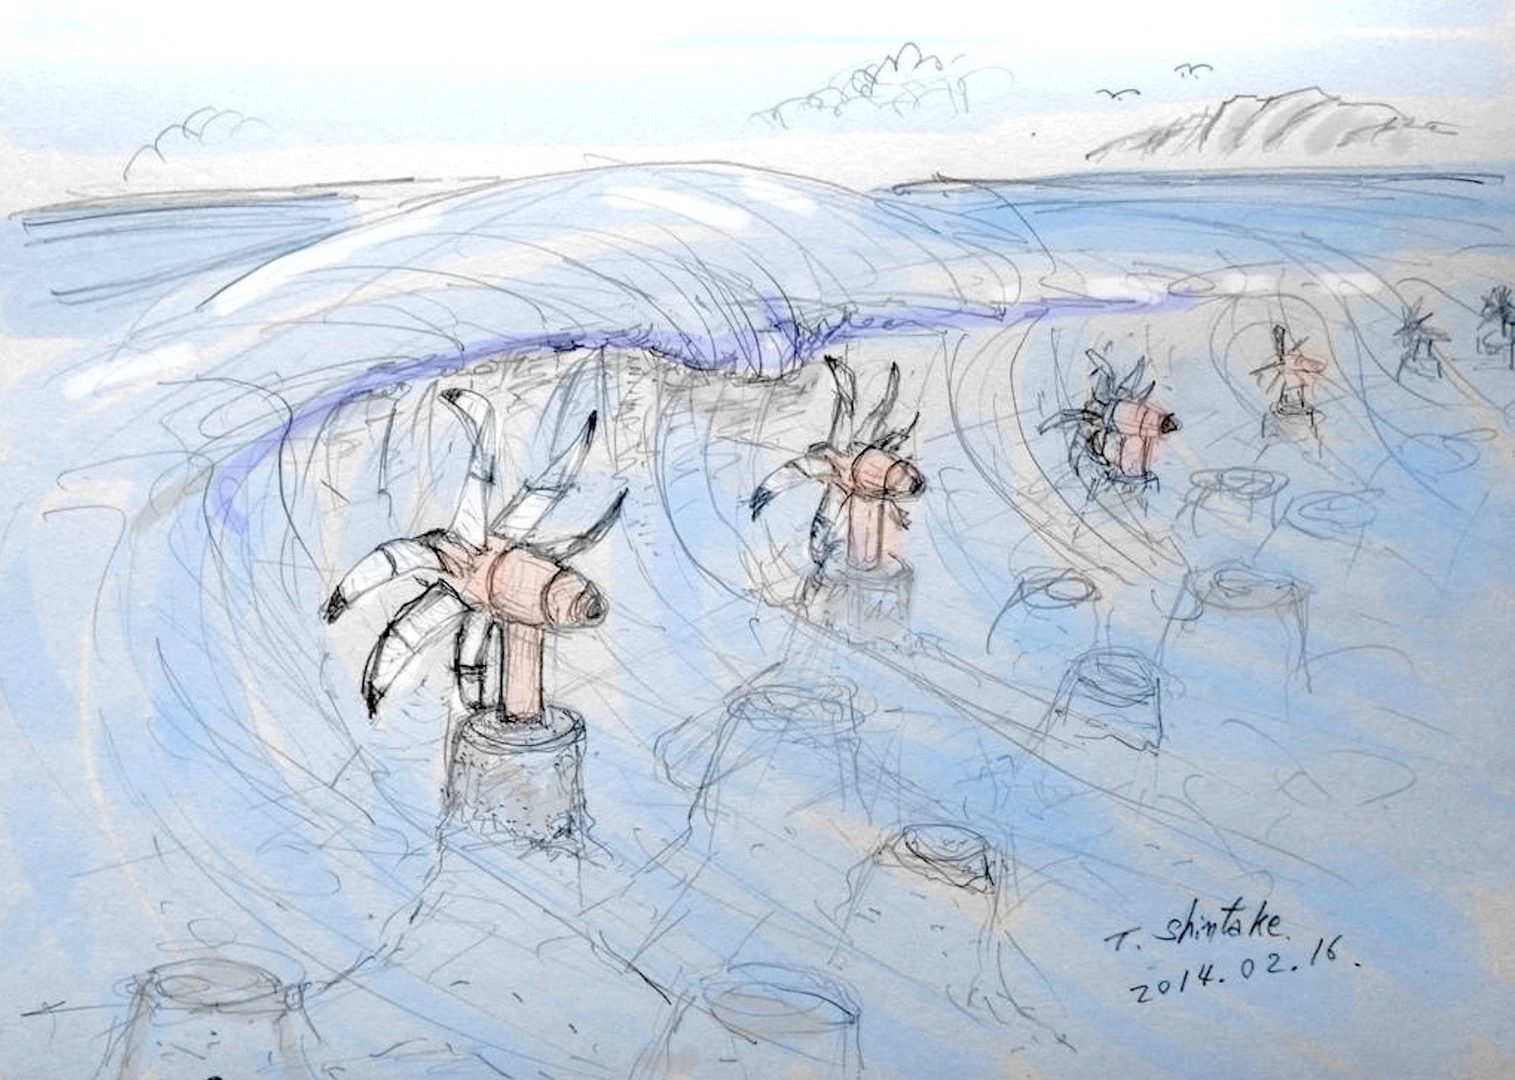
Fig. 1. Arrays of small turbines harness electricity from the rapid flow of breaking waves on shore. They would act as a wave breaker to damp the wave by extracting its kinetic energy.
- Aluminium alloy is fairly resistant to the rusting problem in seawater. Upon oxidation, aluminium becomes alumina (Al2O3), a highly resistant ceramic material, which hermetically passivates the surface of the aluminium body and thus protects from rusting in seawater. It is thus fairly easy to maintain the WEC devices in good condition for a long period of operation in seawater, which reflects back to lowering the maintenance cost.
- Integration of our WECs with seawall will be the best choice, where we use a tapered duct, in order to concentrate the wave power to the turbine. Recently, we have tested 1st prototype model of Ducted-WEC (taper waveguide and ducted turbine), and obtained roughly ten times more power than bare turbine. R&D on this idea will be continued in Phase-II.
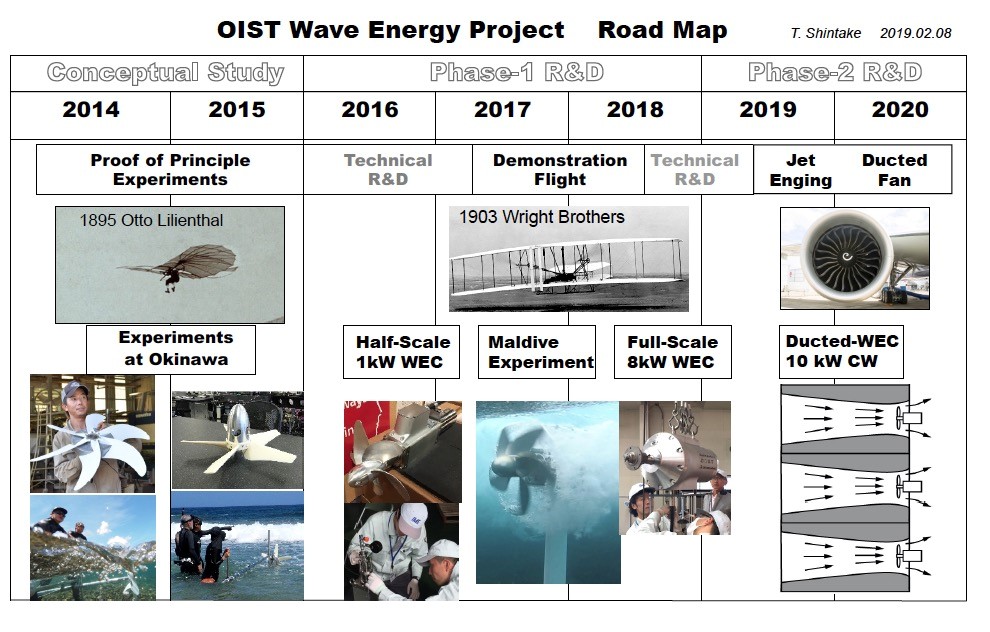
Fig. 2. The road map of OIST Wave Energy Project, comparing with history of the airplane.
Figure 2 shows the road map of OIST Wave Energy Project, comparing with the history of the development of the airplane. The milestones are as follows.
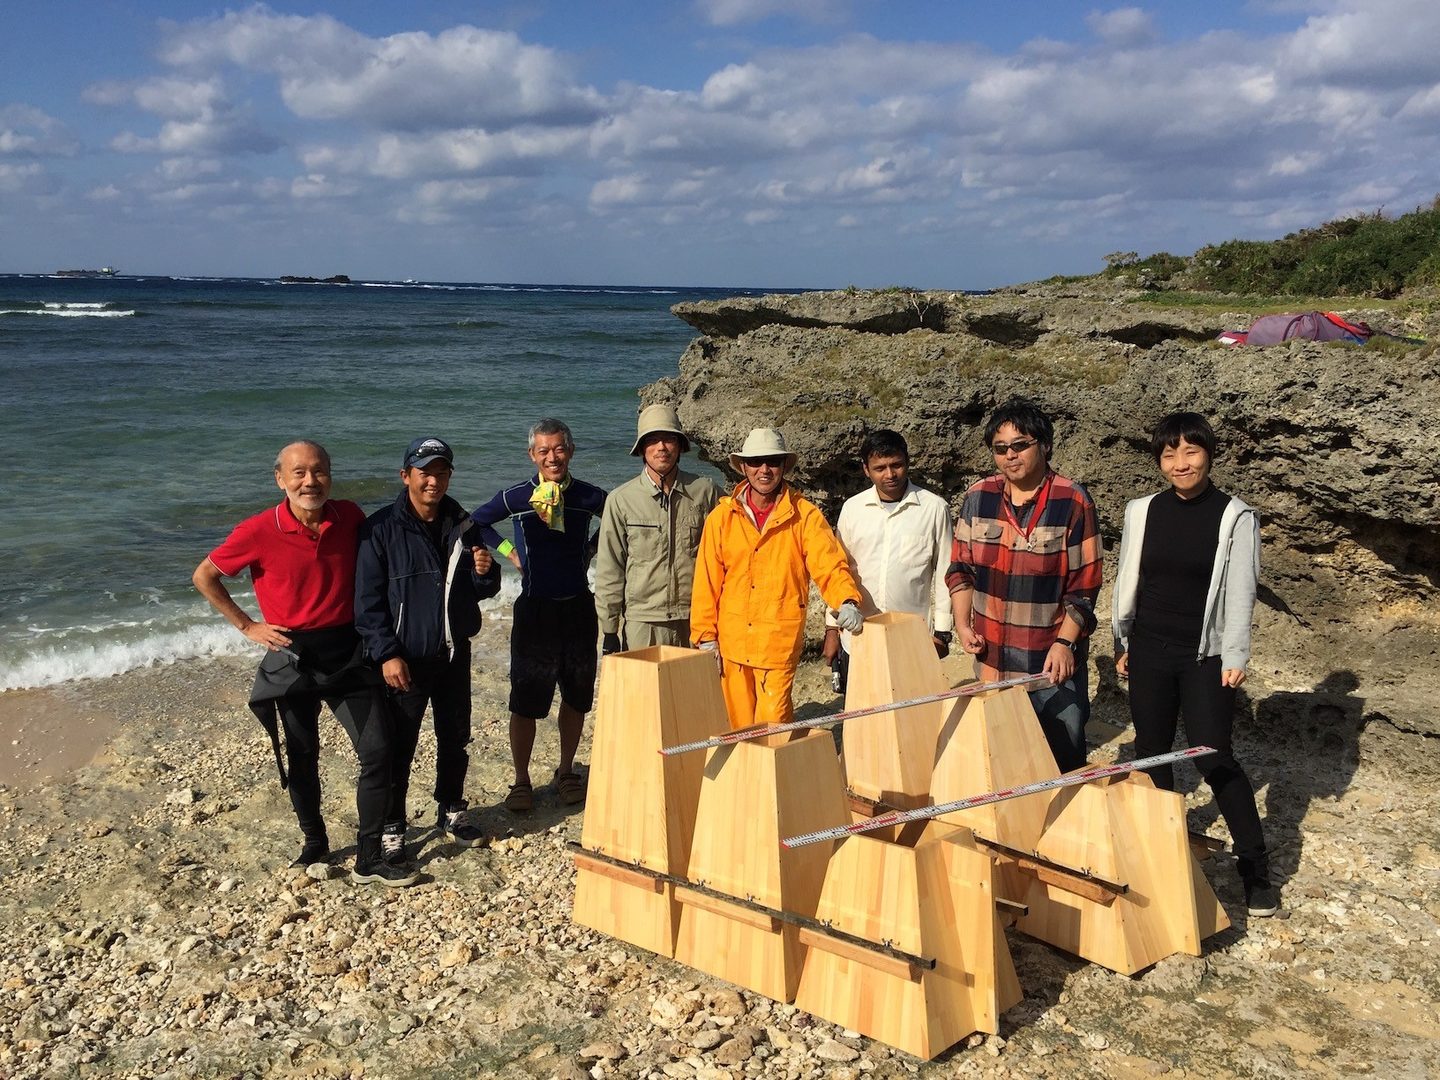
- FY2014-2015: The conceptual design, study and proof of principle experiments, where we proved the working principle by manually carrying turbines into the breaking wave in Okinawa, Japan. Figuratively, we compare the experiments with Otto Lilienthal's first flights with gliders.
- FY2016-2018: Hardware R&Ds Phase-I
We started hardware development of waterproof electric generator and robust open-water turbines. We successfully demonstrated the stability of the freestanding turbine in the breaking wave, and generation of electricity in the Maldives in FY2018. We may compare this event with the first sustained flight of the powered aircraft by Wright brothers.
- FY2019-2020: R&D Phase-II (Higher power and commercial model development)
By introducing our original "Ducted-WEC" concept, we try to significantly increase the power output. A tapered wave-guide structure acts as an energy concentrator. To commercialize our product, we also develop the power conditioner matched with Ducted-WEC, and try to send the electricity to grid.
Here, we are showing the Phase-I R&D, particularly experiences from the field test at Kandooma Island in the Maldives in FY2018. Concerning the power measurement results, we have a separate paper in this conference[5]. The hardware details on WECs were already reported in a previous conference[2,3].
Quick link 2018 2019 2020 Summary References
2018 OIST-WEC Half scale and full scale installation
1. Test Sites
Figure 3 shows our test site at Kandooma Island in Maldives.
(1) We chose Kandooma Island for our Wave Energy field test site. The wave-breaking zone is very close to the island. The Holiday-Inn Resort Kandooma is located nearby on this island, facing towards the famous surfing spot. On other islands, the wave-breaking zone is typically much less accessible (e.g. typically 500 m away from the islands), so Kandooma is very suitable in this regard. Kandooma is also close to Male and International Airport, thus convenient to transport the experimental equipments.
(2) The wave breaking zone is roughly 60 to 70 m away from the sea wall, where we chose the test site. The sea floor is made of coral limestone, which is rather flat, and has no living corals. This is due to the wave breaking activity, i.e., impact force of crashing water repeatedly sweeps the loose stones to the beach.
(3) We installed two half-scale WECs (35 cm turbine, 1.3 kW peak power generator) in May 2018 at roughly 60 m from the seawall, and two full-scale WECs (60 cm turbine, 8 kW peak power generator) in November 2018.
(4) The test site is very close (20 m only) to sewage outlet, and thus we suffered from a fairly active biofouling problem (see later section).
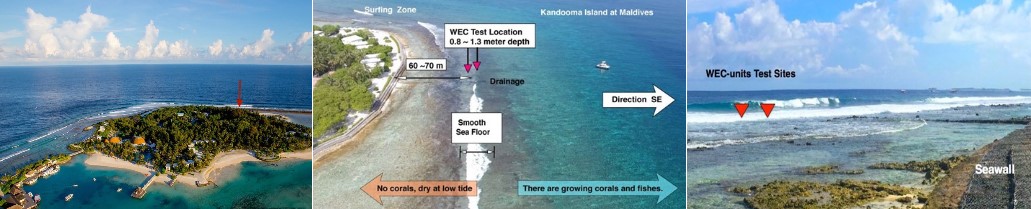
Fig. 3. The installation site is on the beach at the south east side of Kandooma Island. There are no surfers nor divers because of shallow water. The surfing zone is located a few hundred meters north, where there are higher and stable swells and the water is deep enough to avoid crashing to the seabed.
2. Installation Work
Installation work of WECs in the breaking wave zone was a highly technical challenge. In the Maldives area, strong swells arrive everyday through the year. They do not stop, thus the wave power is an excellent energy source, but a consequence is that we have to work right in the middle of the breaking wave during installation. The water speed of the rip part of the breaking wave reaches higher than 6 m/sec [3], and thus it causes strong impacts on the workers standing in the water. Therefore, it is very dangerous to do some work there, especially working with powered tools such as powered drills or hammer. If a worker fell down, running tools would cause serious injury. Additionally, we have to consider high risk of electrical shock if we use an electrical motor in the seawater.
Therefore, we need to use "oil hydraulic drive motor", which requires a massive oil pump and engine-generator right near to the site. However, we cannot approach to the site by boat carrying stuff on from the sea, because the site is very shallow.
It is also prohibited to bring power shovels onto the beach, because the site is on a resort island, and also because of a need to preserve nature in the area.
Therefore, the installation work was the most complicated puzzle that had to be solved in the project.
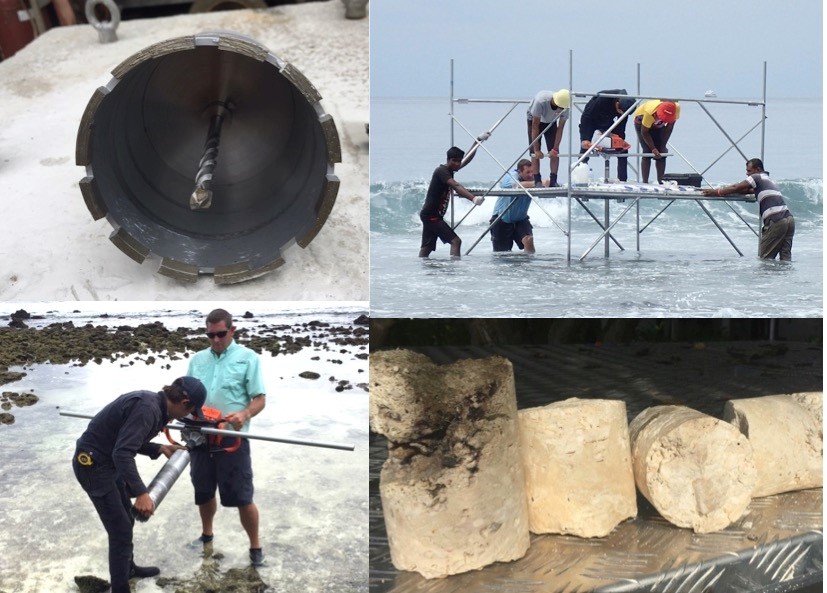
Fig. 4. Drilling into the sea floor with core drill. We used a gasoline engine (75 cc cylinder two-cycle) to drive the core drill.
First we made holes on the sea floor, using the equipment shown in Fig. 4. We carried a working stage (aluminium made, it is light and easy to handle) into the site. The stage is above the sea level at the breaking wave zone, and the breaking wave passes through under the stage, so that the workers are safe. By standing on the stage, using core-drill (110 mm outer diameter) with long extension pipes (~2 m), connected to powered gasoline engine; we made four holes on the seabed. As seen in Fig. 4, we removed cores, which contained many voids and gaps, but were nevertheless very stiff. We could reach a sufficient depth of 400 mm, despite the fact that the drilling speed was much slower at the real site, than we had experienced before at a test drilling on a concrete floor. Thus, we took almost two days to drill four holes (two for half-scale WECs and two for full-scale WECs).
We then inserted the socket into the hole, and fixed with ceramic-balls and epoxy cement, as shown in Fig.5 and Fig. 6. The ceramic-balls fill up the gap (5 mm) around the socket, where the diameter of the ceramic ball was chosen as 2 to 3 mm, in order to form a crystal-like structure (FCC) inside gap, providing very stiff packing structure. To prevent washing out of the balls from the surface by rushing water, we covered the gap at the top with epoxy cement. Initially, we had intended to completely fill the gap with the epoxy cement, but unfortunately the epoxy was quickly "frozen" before going down into the gap. The cause of this problem was that the usual chemical reaction during the linking process in the epoxy generates heat and raises temperature, but in our case the rushing water removed heat and temperature dropped quickly, causing the epoxy to freeze.
As shown in Fig. 5, a part of the power cable is hidden inside the support stem to avoid damage due to flapping in the wave.
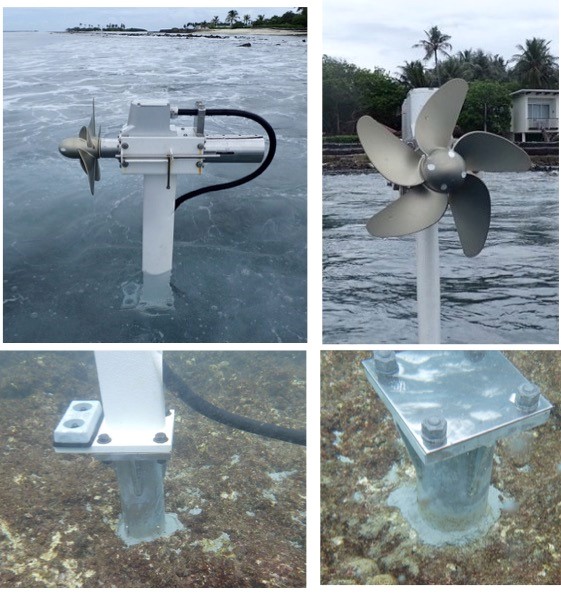
Fig. 5. After drilling the holes, we inserted the sockets, and filled the gap with ceramic-balls, then sealed with epoxy cement on the top. Then we mounted the WEC support, by inserting it into the socket. The square block in the bottom left photo is the zinc anode to reduce rusting.
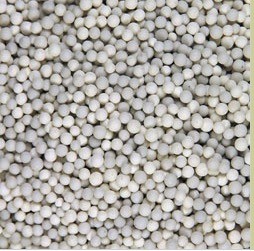
Fig. 6. We filled the ceramic balls (porcelain) of 2~3 mm diameter in the cylindrical gap, to form a crystal-like rigid structure and support the socket. The repeating vibration by the breaking wave improves the filling factor inside the packed balls with self-aligning mechanism.
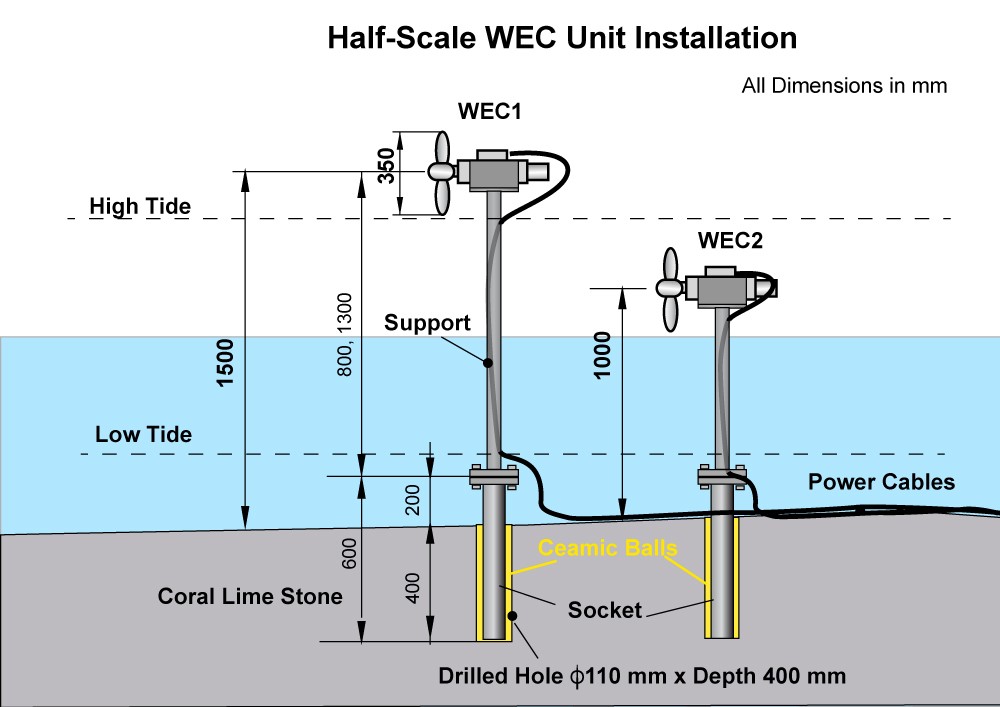
Fig. 7. We mount the WEC unit by a support socket inserted in the vertical hole: 110 mm diameter made by core drill.6. Meetings and Events
3. Operation of Half-Scale WECs
Swell height in the Maldives is higher in monsoon season and lower in dry-season. The monsoon season (wet west wind) in the Maldives starts in May or June and ends in September or October; varying from year to year. The dry season (dry north east wind) starts in October or November and ends May or June. People in Maldives frequently said the two seasons are mixing in recent years; it might be due to climate change also. Typically swell heights in monsoon season are 1 m to 1.5 m, with 10-second period, arriving from southeast. In dry season, swells become 0.3 m to 0.5 m high, with 8 sec period, and arrive from northeast. When we installed two half-scale WECs, the monsoon was already starting, thus we had high swells as shown in Fig. 8.
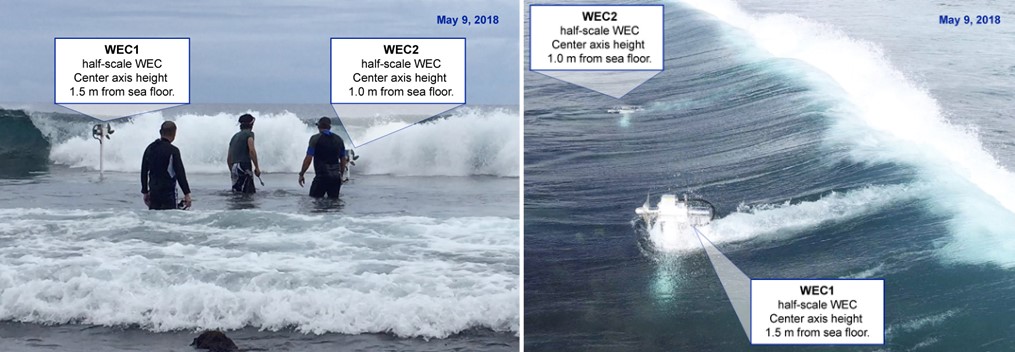
Fig. 8. (left) Strong surf wave breaks in front of WECs, (right) two WECs standing and generating electricity daily in the breaking waves.
Fig. 8. (left) Strong surf wave breaks in front of WECs, (right) two WECs standing and generating electricity daily in the breaking waves.
Right after the installation, we opened the lock on the turbines, and started operation. Fig. 8 (left), we see the height of the breaking wave is close to the height of men (~1.7 m) standing on sea floor; thus the net wave height (from the water surface to the top of the wave) was roughly 1 m. In Fig. 8 (right) (from a drone), the wake of the turbine tells us how the breaking wave runs in towards the beach horizontally, which rotates the turbine in the same way as a hydro-turbine standing in a river. This is an important understanding that we have gained on the breaking wave phenomena, i.e., the water in the breaking wave does not simply fall down vertically, but rather flies on forwards. This nicely demonstrates that it is a useful energy source, and can be harnessed by the horizontal axis turbine. This is the working principle in our OIST wave energy converter.
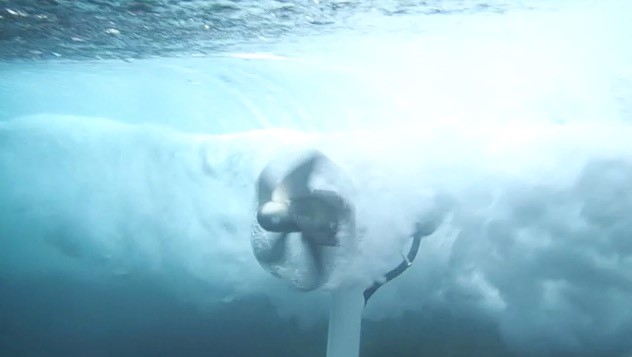
Figure 9 Nicely running turbine in a breaking wave.
Figure 9 shows a movie cut of the rotating turbine inside wave. Behind of the turbine, we see a "cloud" like white object, which is the water surface of the "tube" inside the surf-wave. The turbine had just moved from the air to the water in this cut, and thus there were sheets of air still remaining around the turbine blades. In this condition, hydrodynamic performance of a turbine should be poor, i.e., the lift force of the blade (source of the rotation torque and the power) should be low, and as a result, the electricity generation becomes lower.
This is an important issue in our project. We are trying to solve this problem in Phase-II R&D now, i.e., we introduce a taper waveguide in front of the turbine and use a ducted-turbine similar to the bulb hydro turbines or Kaplan turbine.
4. Power Monitoring
The power measurement system was installed in a new shed right next to the existing power house (the diesel generators) in Kandooma Island.
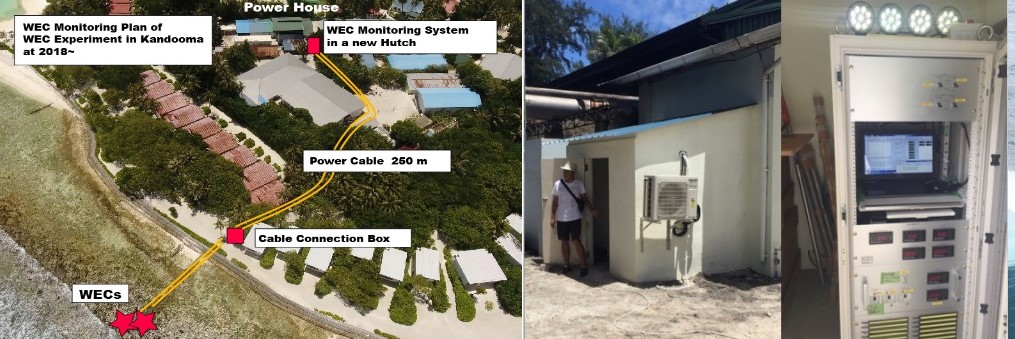
Fig. 10. Power monitoring system and power cables. | Fig. 11. Power monitoring shed and monitoring system.
The shed is air-conditioned at 25 degrees (Celsius). The power monitoring system receives power from two WECs and the voltages are recorded, and then stored into EDLC (Electric double-layer capacitor), which drives LED lights on the system. A PC computer is recording all data and also sending the recorded files to the cloud storage. At the same time, screen images are uploaded every second to the cloud, by means of Screenleap API, which we can see from the website as shown in Fig. 12.
Fig. 13 shows the output voltage for ten months operation, from May 2018 until today (February 2019). At the end of November 2018, we installed two full-scale WECs, and connected them to the power monitor system, replacing the connections to WEC1 and WEC2 (thus we have to actually readWEC1 as WEC3 and WEC2 as WEC4, in Fig. 13). The output voltage shows a downward trend, which is partly due to seasonal change of wave power (high in monsoon and low in dry season). The other source of this trend is the biofouling problem, see next section.
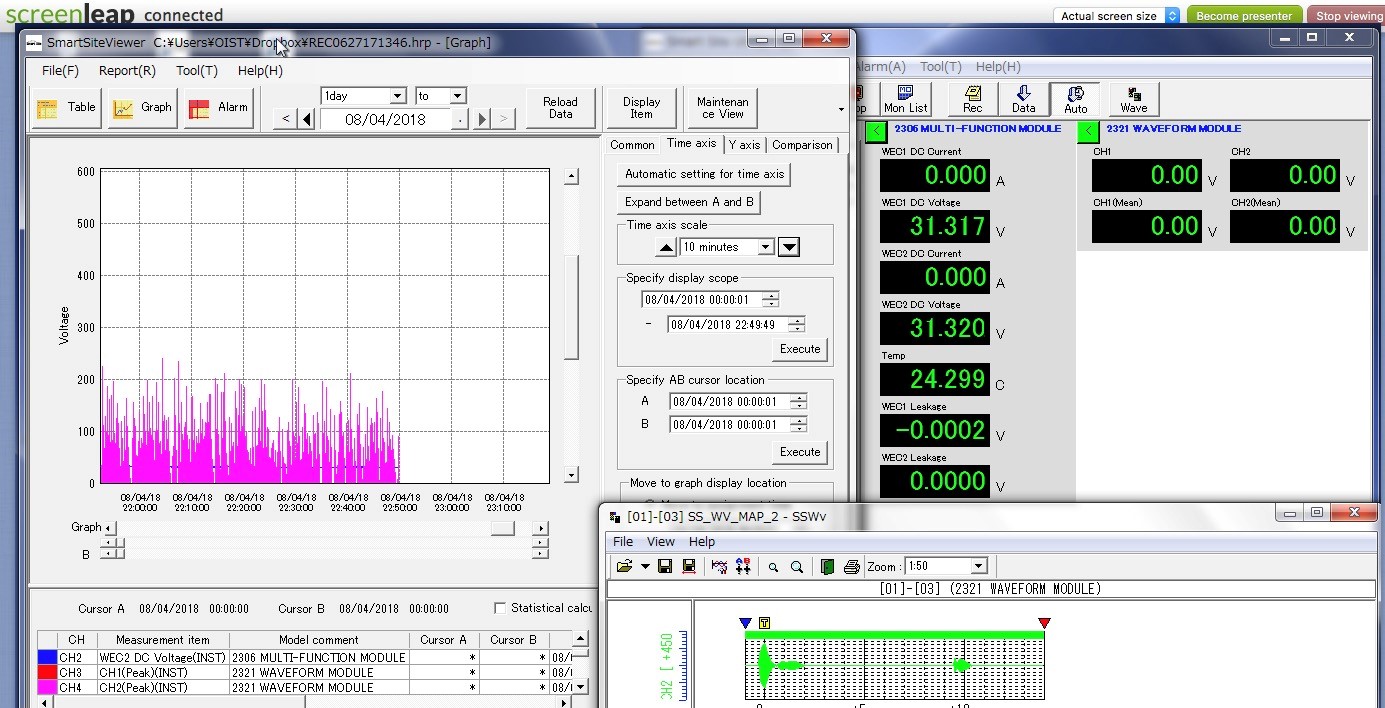
Fig. 12. Example of Screenleap image. Left graph shows the peak power generation in each wave, and the right is the current flow, voltage on capacitor, and leakage current from the power cable.
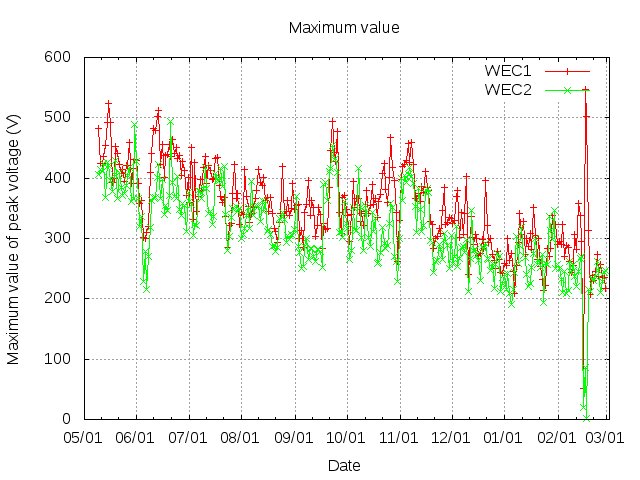
Figure 13 Trend of the output voltage for ten months operation (from May 2018 until February 2019). At the end of November 2018, we installed two full-scale WECs, and connected them to the power monitor system, replacing the connections to the original half-scale turbines (thus in the graph legend above, we must read WEC1 as WEC3, and WEC2 as WEC4). In February 2019, we shortly tested 1st prototype Ducted-WEC, thus the voltage went up drastically high.
5. Biofueling Issue
The test site is very close (20 m only) to sewage outlet, and thus we suffered from a fairly active biofouling problem.
(1) On September18th 2018, we cleaned the half-scale turbines. As seen on the pictures, the turbine and generator were totally covered by algae within five months after installation on May 2018.
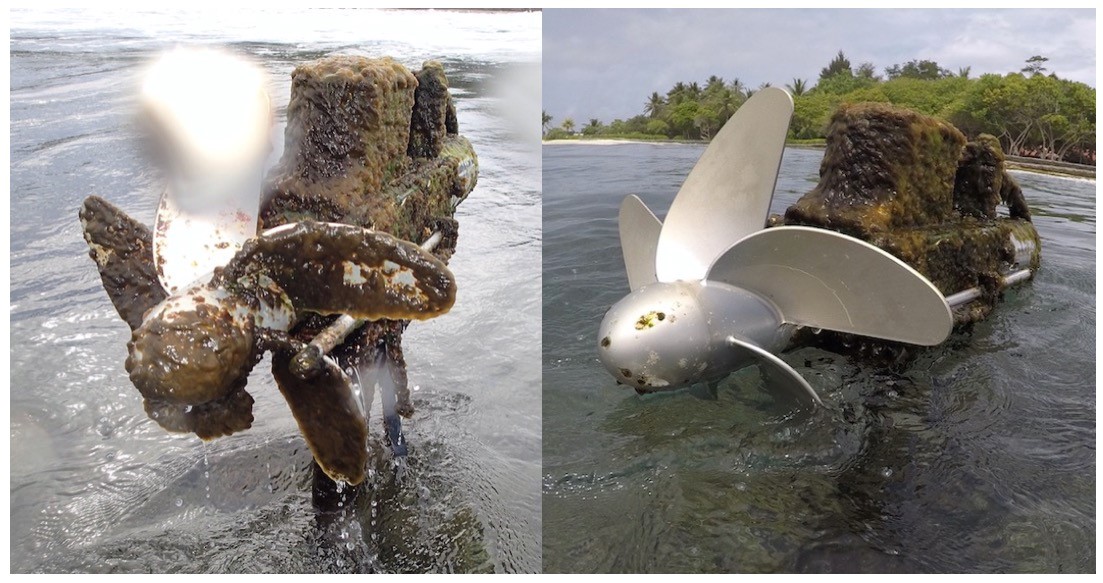
Figure 14 Half-scale turbine before and after cleaning on Sep. 18th, 2018.
(2) By cleaning the turbines, the output peak voltages from these generators went up roughly 150 V to 250 V (by 1.5 times). In the power scale, it is roughly two times of increase.
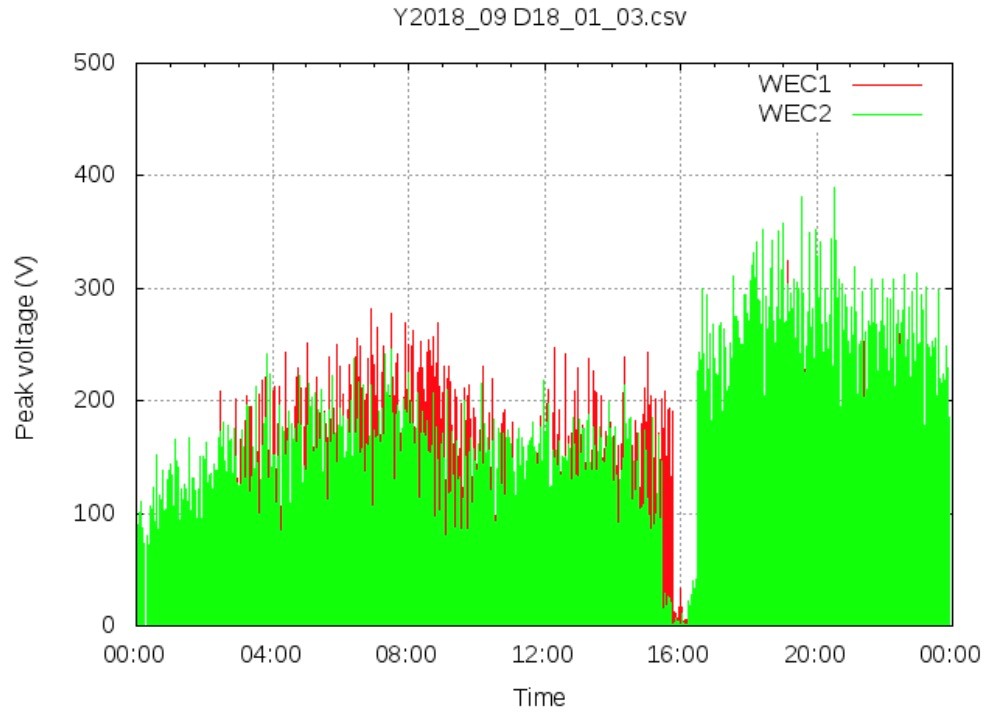
Fig. 15. The peak output voltages were fully recovered after cleaning.
(3) The electrical and mechanical performances of the generator have not yet been degraded by the algae growth.
(4) In the tidal power turbine, the barnacle growth is the most serious problem, i.e., which drastically degrades the turbine performance and it is hard to remove them. In our wave energy converter, there is no barnacle growth on the turbine and generator. This is due to that the turbine and generator are located higher than average sea level (refer to Fig. 7), and thus barnacle cannot live there. On the other hand, the power cables are located under water, and thus we found barnacles there, while they do not damage the cable fortunately.
(5) In order to find the best surface coating, we performed sample test. We made six discs made by aluminum plate (1 mm thick), and applied different polymer coatings. We mounted them on the support shaft of WEC1. Two and half months later, we observed them and found that FEP(Teflon) and PEs Polyester are suitable to reduce algae growth. We believe the surface roughness affects growing speed of the algae, i.e., a smoother surface provides better result.

Fig. 16. Two and half months seawater test in Maldives. FEP(Teflon) and PEs Polyester are suitable to reduce algae growth
We are also testing different types of the bottom ship paint, while higher performance paints are generally expensive. We should choose the paint or coating depending on target functions of each component and looking at the total cost.
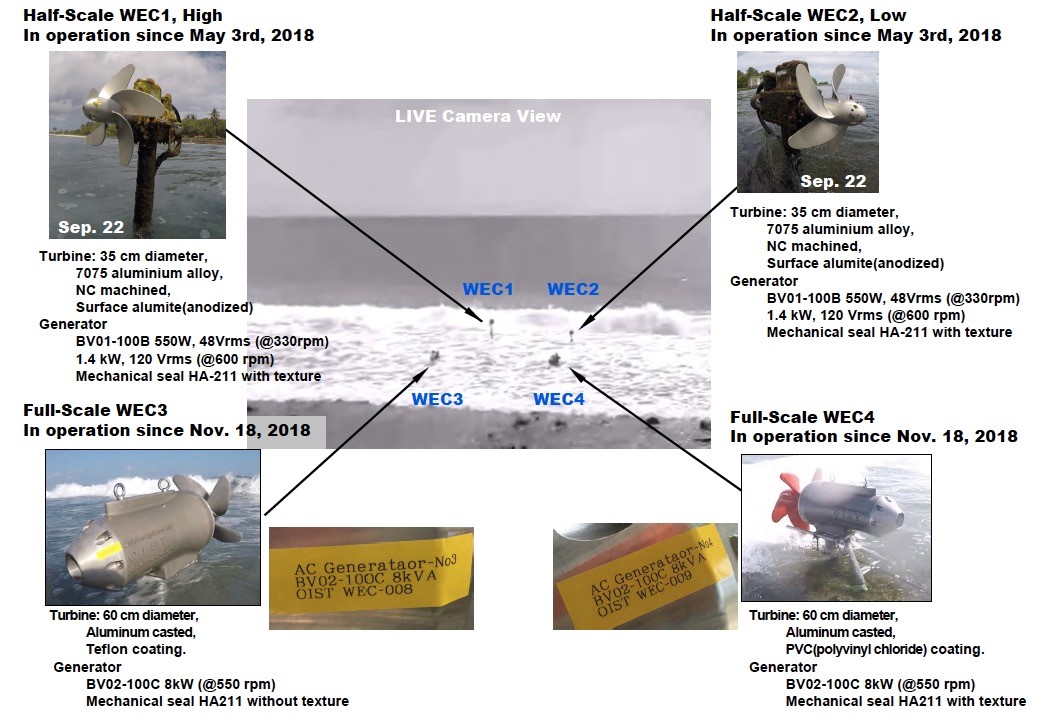
Fig. 17. We have been testing four WECs; two half-scale WEC1, WEC2 and two full-scale WEC3, WEC4 as shown in this figure (November 2018~ February 2019). In February 2019, we removed two half-scale WEC1 and WEC2, and shortly tested 1st Ducted WEC at WEC2 position.
2019 Full-scale ducted OIST - WEC installation
1. Full-Scale WECs
In November 2018, we installed two full-scale WECs (shown in Fig. 18) at the same test site. Since then we have been testing four WECs as shown in Fig. 17.
Main scope of the full scale WECs R&D is to develop efficient electric generator to match with the 60 cm diameter turbine, i.e., 8 kW power output at a low rotation speed of 550 rpm. At the same speed of water, larger turbine rotates slower, thus higher power system requires massive generator. To meet this target, we need to use larger size of permanent magnet array, and larger stator core, while the total weight has to be within a certain limited value to make possible the installation with manpower in the beach. Using aluminum casted housing, we could make the total weight around 200 kg, and we successfully installed them by seven workers.
The other R&D item was to investigate each components, i.e., reliable permanent magnet assembly, safety magnet handling, seal performance of the larger size mechanical seal, aluminum casting process and total assembly process.
We keep running two full-scale WECs in the water until October 2019. Then, we install full-scale Ducted-WECs (concrete duct, 5-ton weight), in which, we will reuse the full-scale WECs as the ducted turbine of the full-scale Ducted-WEC.
At the end of FY2019, we need a 30 kW generator to meet 10 kW average output power from the full-scale Ducted-WEC. This parameter will be realized by (1) speeding up the turbine rotation to 800 rpm with guide vane technique, and (2) increase number of permanent magnet array.
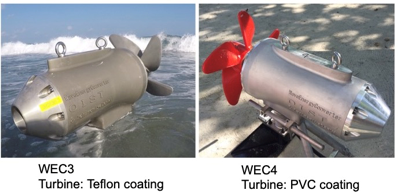
Fig. 18. Full-scale WECs. To investigate surface coating for the biofouling, we applied polymer coating on those turbines.
2. 1st Field Test on OIST Ducted-WEC
We propose a new scheme Ducted-WEC: Taper Waveguide and Ducted Turbine, which focuses the water flow in the taper waveguide, eliminates turbulent components, and finally creates parallel flow into the ducted turbine. In order to verify power gain of the Ducted-WEC in real breaking wave, we fabricated one straight taper structure with aluminum plates as shown in Fig.19. The input window is W 1 m x H 1 m, taper length is 1 m long, the output window is W 0.4 m x H 0.4 m, the duct diameter 0.4 m, and the turbine diameter is 0.37 m.
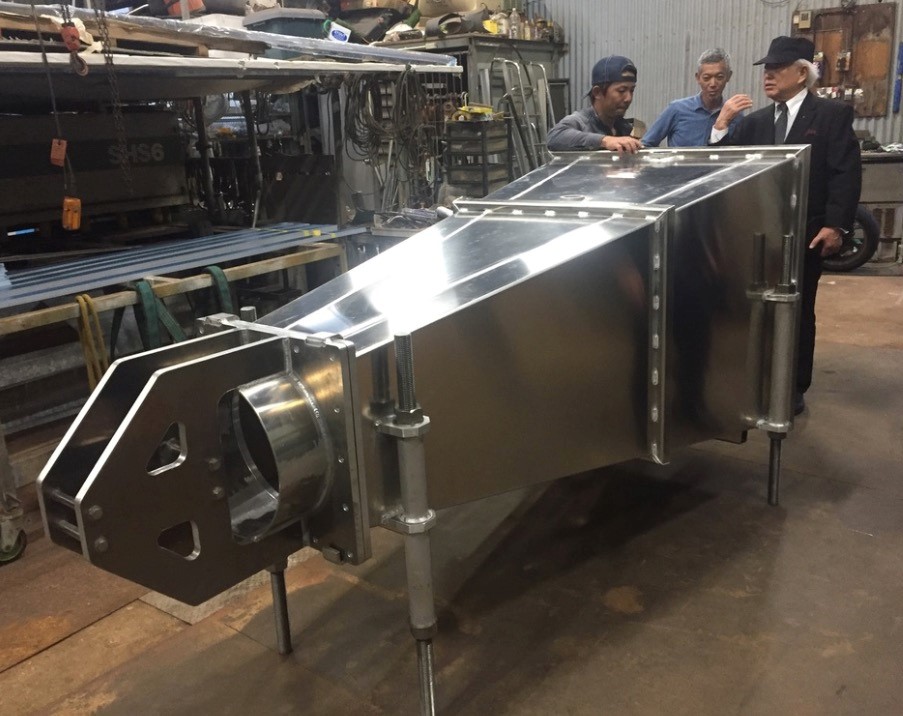
Fig. 19. Ducted-WEC concept, and 1st prototype model made by aluminum plate. We attached the half scale WEC to the end of this taper.
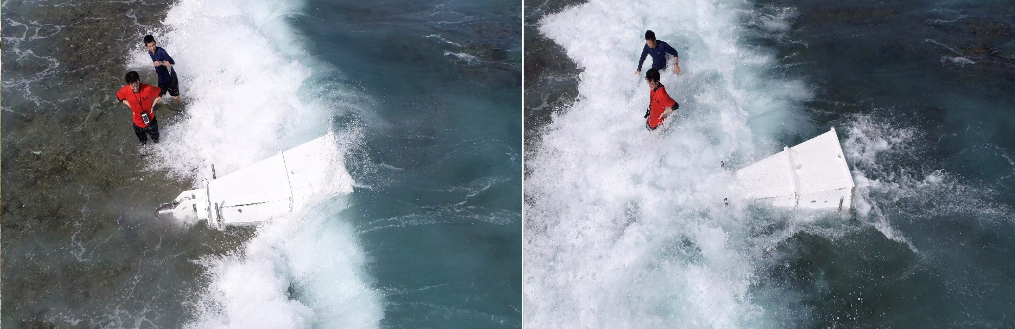
Fig.20 Movie taken by a drone. It is very shallow water and flat floor, thus the breaking water runs fairly fast. Wave height was ~0.5 m out sea at Male.
From Fig. 20, we can estimate the water speed (front foam) around the taper as roughly 4 m/sec, while the water speed inside taper was 6~8 m/sec estimated by the output voltage from the generator. The root mean square (RMS) of the output voltage is shown in Fig. 21. The voltage was increased 2.5 times by using Ducted-WEC. Since the square of RMS value gives rough estimate of the average power output, the power was increased roughly six times by using Ducted-WEC than the bare freestanding full-scale WECs.
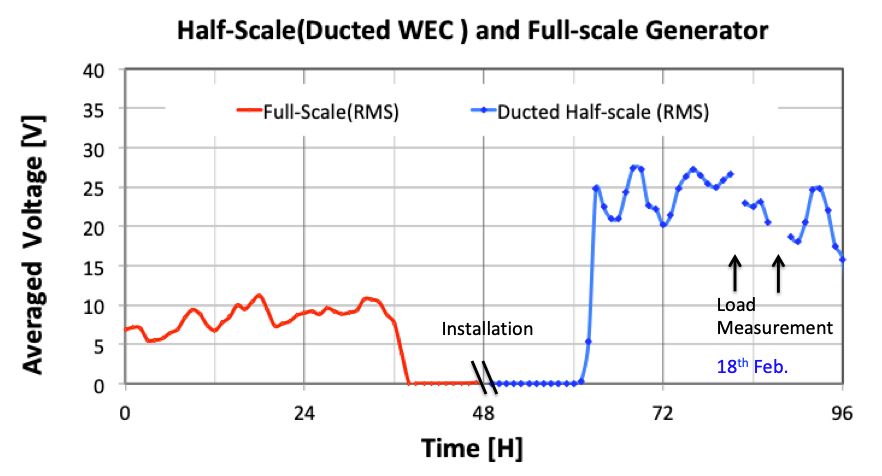
Fig.21 Output voltage (RMS) was drastically increased by the Ducted-WEC.
Unfortunate, due to the power of the breaking wave, the aluminum plates Duct failed during the test. An initial crack has actually occurred during the fabrication of the duct, specifically during the bending process of the 5mm thick aluminum plate. Due to the tight schedule for the test, the fabrication was continued despite of the crack and a rib-cage structure was added in the center of the taper to strengthen the Taper-Duct. This initial crack combined with the concentrated water pressure led to the inner top corner part ripped (Figure 22). This then made the water came out from the side instead of the intended outlet. This occurs after just a couple hours of usage and reduce the outlet water pressure (thus reducing the overall power take-off). Nevertheless, this further proved the enormous power of the wave and also showed that a more robust design and fabrication of the duct is needed.
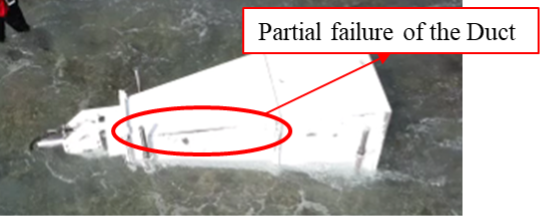
Figure 22 Taper duct wave guide during field testing. The partial failure of the Duct can be seen at the rear corner near the Duct outlet. It is estimated that the failure occurs due to pressure concentration in the inner corner of the duct.
3. 2nd Field Teston OIST Ducted-WEC at the Port of Seragaki
Considering the increase in voltage output when the Duct was utilized, a new and improved design of the Taper Duct is needed. Based on the failure in the past, we designed and made a new and improved model of the Duct Taper as shown in Figure 23. This time the cross-section is circular, thus eliminating the possibility of pressure being concentrated in the inner corner of the duct. The full-scale prototype of both the turbine and the duct are currently being tested in OIST Marine Science Station located in the Port of Seragaki, Okinawa. The structure is located around 20m off the Seragaki seawall facing NNW (North North-West) direction.
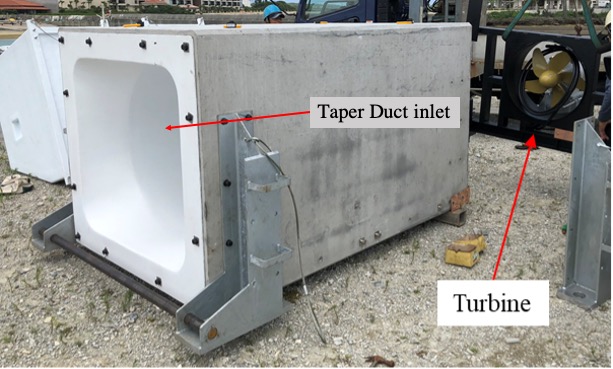
Figure 23 A full scale prototype of the Taper duct and the turbine during assembly at Seragaki Port, Okinawa. The assembly was done on land.
Parts of the full-scale Duct-WEC prototype arrived at Seragaki Port on Monday, 1st of July 2019. The assembly was done on land before the complete structure transported to the intended location off the seawall. After assembled, floaters were attached to float the device during transportation. Figure 24 shows the structure surrounded by floaters being lifted to the water before being towed to the open ocean by a small boat. Figure 25 shows the structure installed in the intended location. A small LED beacon light is also installed (painted yellow in the figure) to inform fishermen’s and other ship of the location of the structure, especially at night. During high tide, it is possible for the structure to be completely under water thus making it invisible to the naked eye during the night. As the wave passes, sea water enters the taper duct and rotate the turbine (Figure 26)
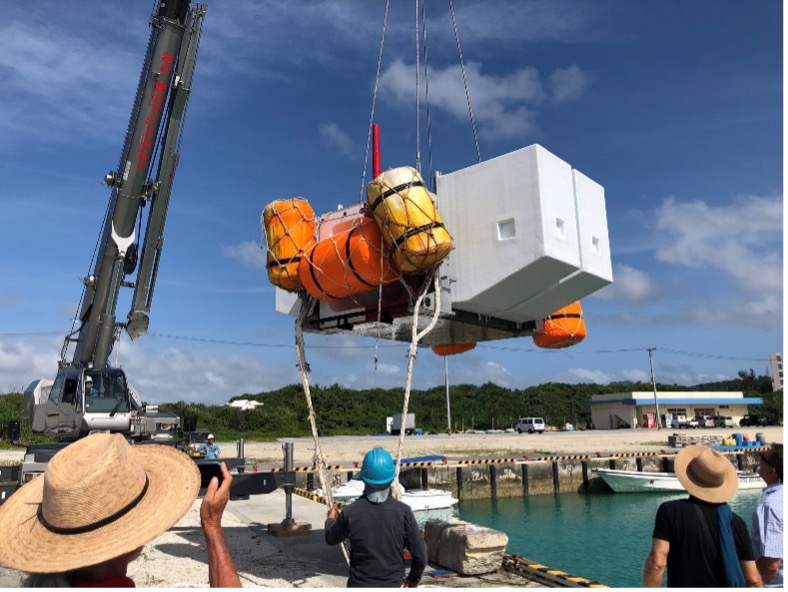
Figure 24 The complete structure of the WEC surrounded by floaters being lifted into the water using a heavy machinery. The complete structure is light enough to be towed the designed location using small boat.
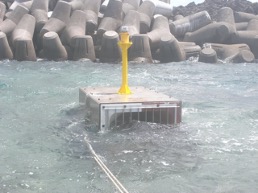
Figure 25 The complete structure after installation at the Port of Seragaki. A small LED beacon is fixed on the top of the structure to warn passing ship or boat of the structure’s existence especially during the night.
Figure 26 Full-scale prototype OIST WEC during operation, the turbine is rotating due to wave passing.
4. Port of Seragaki experiment's monitoring system
Similar to the monitoring mechanism deployed in Maldives, a power generation measurement system is installed in the pump station facility near the Seragaki seawall. The same power storing technology by using EDLC (Electric double-layer capacitor) is also deployed in here and the power output can be viewed remotely using screen share software. The power generated data is being recorded to the cloud storage. A CCTV camera is also deployed to view the power generator device during day to day operation. Both powers generated and the CCTV video output can be viewed online using the link provided above namely “Seragaki Monitor and live Camera” (Figure 27).
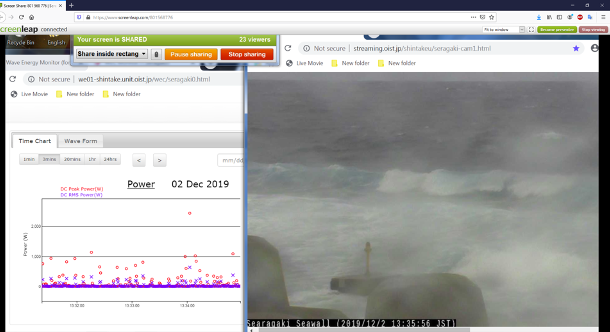
Figure 27 Print screen image of the screen shared Seragaki monitor and live camera which can be streamed online.
5. Electricity generation
The power generation was officially recorded starting on 17th of September and Figures 28 (a) and (b) show the Peak Power generation recorded (in Watt) in September and October 2019, respectively. It is important to note that powerful Typhoon Tapah passed through Okinawa on 21st of September 2019 and the remaining strong wind resulted in about 7kW peak power between the 21st and 22nd of September 2019, albeit in a reduced-loads to avoid mechanical and electrical failure of WEC-Unit.
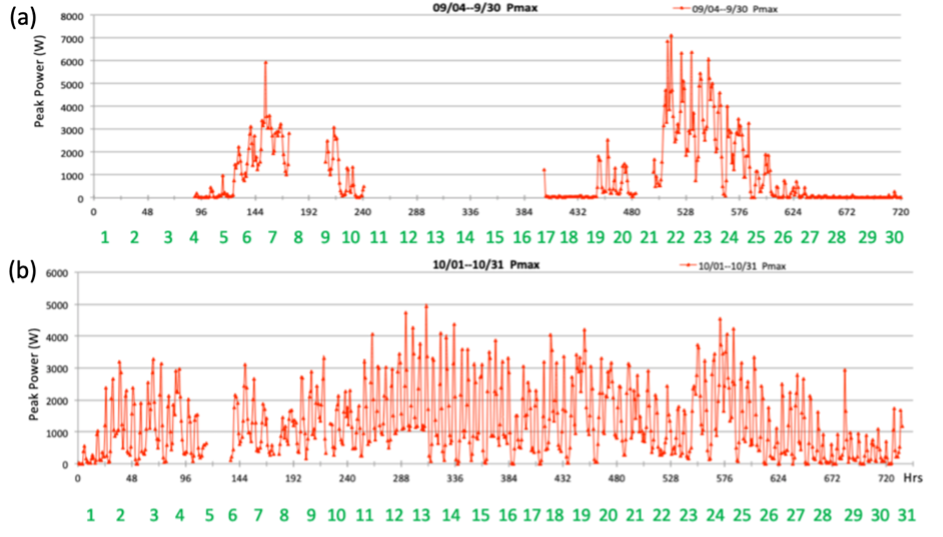
Figure 28 Peak power generated by the Ducted WEC-Unit history at the start of operation on September (a) and October (b)
The power generating action of the device during the Typhoon event can be seen in drone video as shown in Figure 29, although it is important to be noted that the video was taken one day after the peak Typhoon event due to safety. Can be seen from the figure that as the wave passed, the water entered the Duct and directed into the turbine and generate electricity.

Figure 29 Drone footage of the novel Ducted OIST-WEC device during typhoon
2020 Ducted OIST-WEC design improvement and maldives installation preparation
1. Design Improvement and Installation
Upon routine inspection in February 2020, it is found that the turbine is broken with the failed turbine blade found near the device. After close inspection, it is possible that the failure happened because of excessive wave loads experienced by the turbine. This required a quick and proper design improvement to the original design. Figure 30 shows the schematic of the improved design. An "L" shaped extension to the original Duct design is added and the turbine is placed at the outlet. This is done in order to avoid direct impact from the breaking wave to the turbine, which can be observed during the initial operation. Furthermore, the generator is placed above the sea water level to reduce submergence time to reduce biofouling, thus reducing maintenance timing. After much delay related to the pandemic, the full-scale prototype of the improved design was installed at the Port of Seragaki in November 2020 (Figure 31)
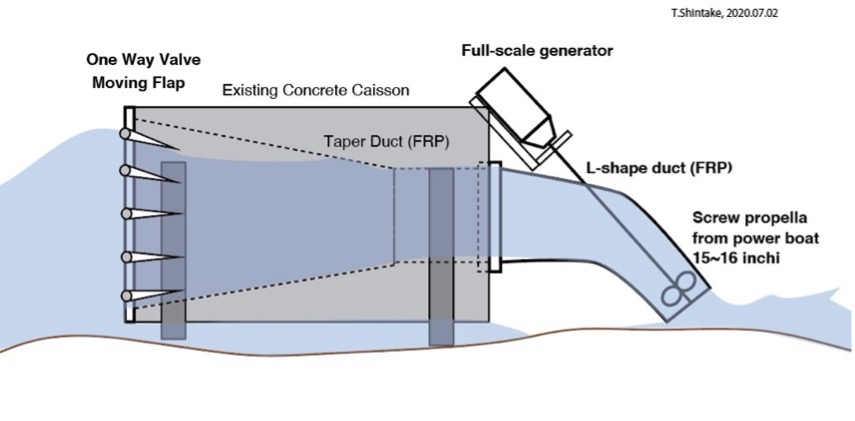
Figure 30 Schematic of the improved design of the Ducted OIST-WEC
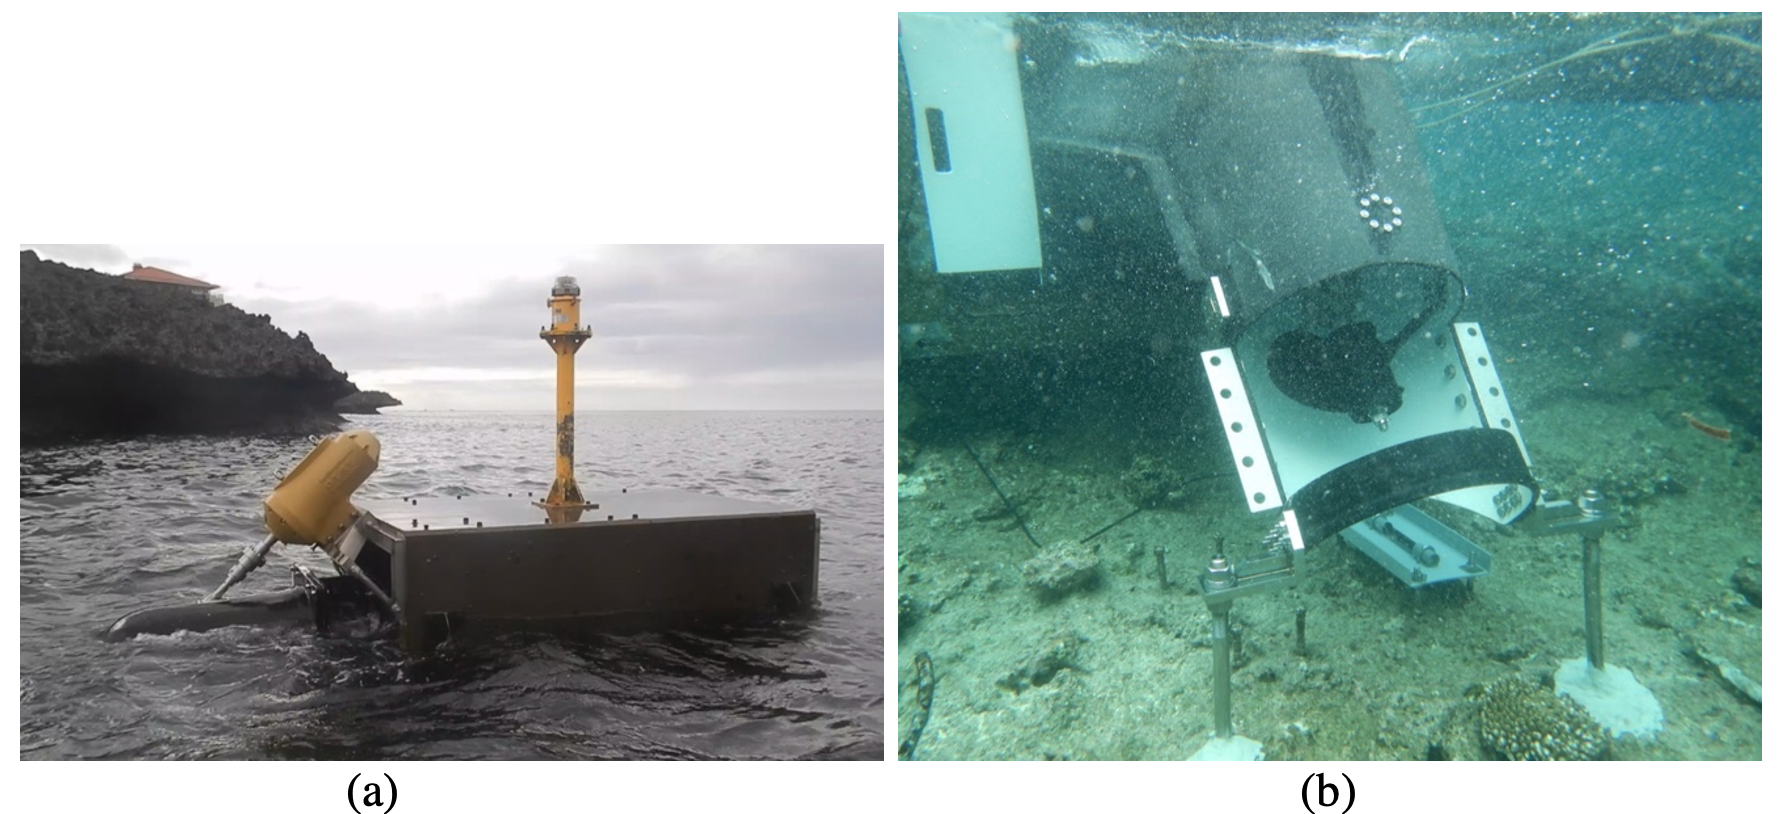
Figure 31 Improved-Ducted WEC installed at Seragaki site. (a) overall configuration, and (b) submerged turbine viewed through access port
2. Energy Globe Foundation visit to OIST
In November, we received a visit from Dr. Ingomar Lochschmidt, the Commercial Counsellor of the Austrian Embassy, on behalf of the Energy Globe Foundation, to hand in the prestigious Global Energy Award for Maldives 2020 which awarded to the OIST-WEC project currently done in Maldives (Figure 32).
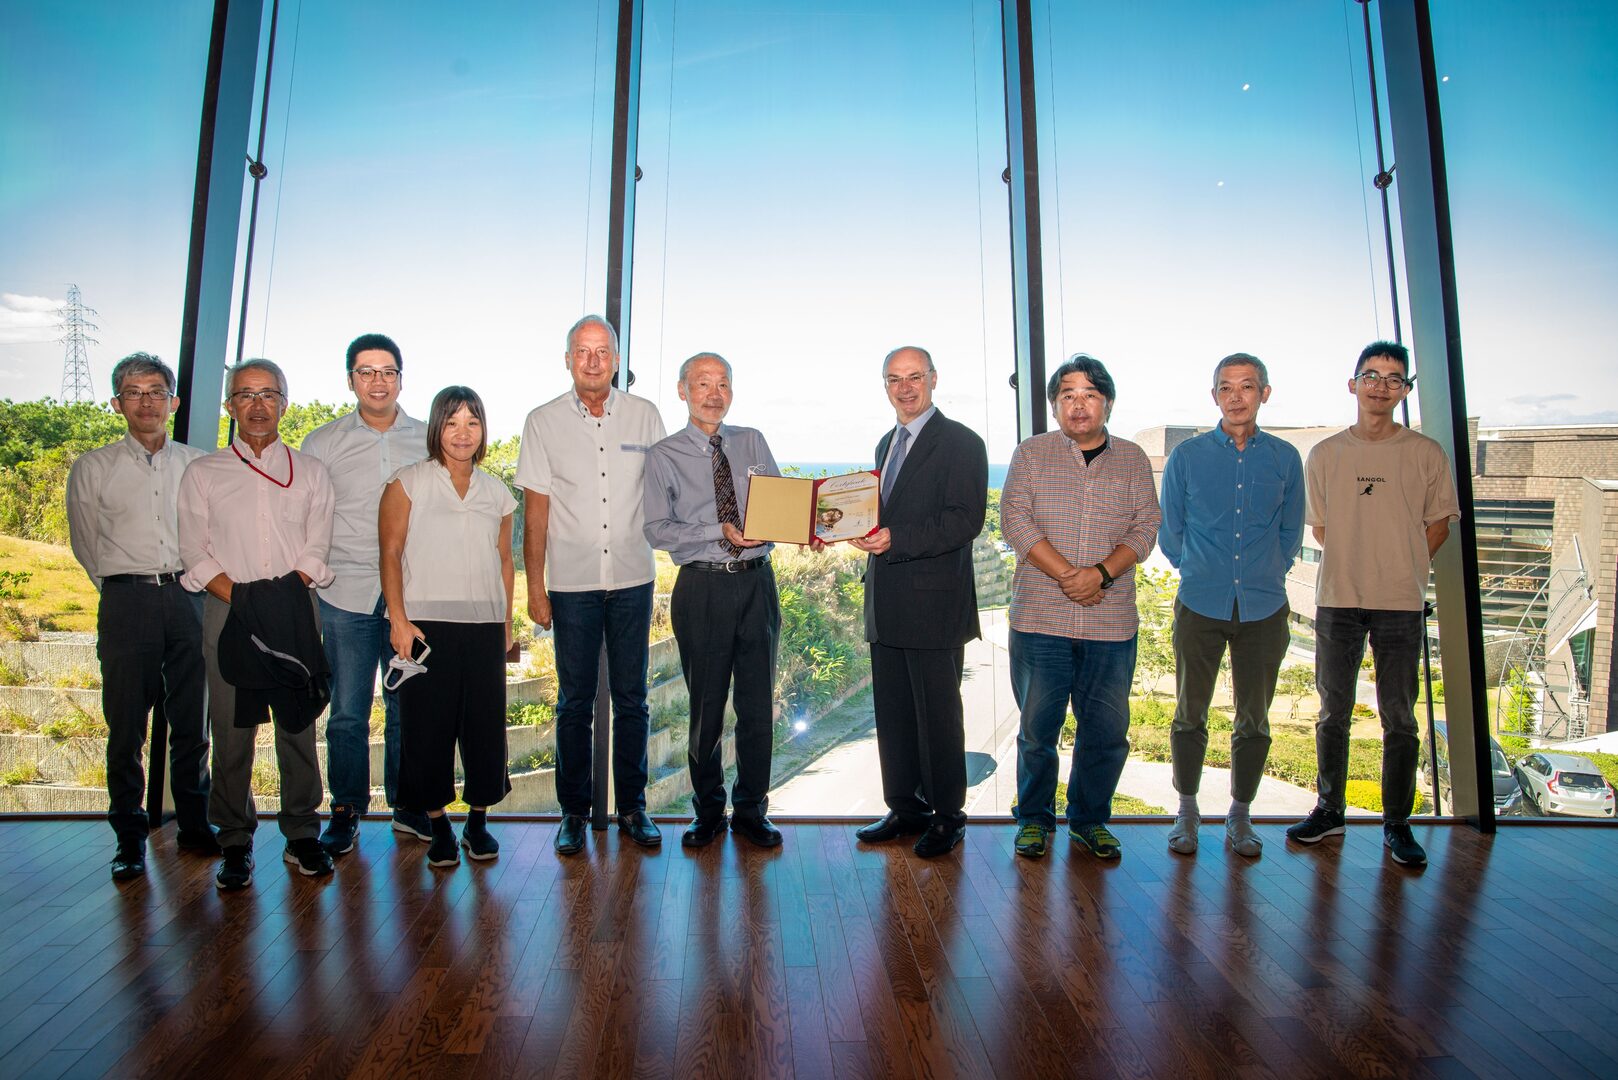
Figure 32 Dr Ingomar Lochschmidt, Commercial Counsellor of the Austrian Embassy Commercial Section, giving award to Professor Tsumoru Shintake, President Peter Gruss, along with OIST Wave Energy Team during his visit to OIST on 27th Nov 2020
Summary
(1) Two half-scale WECs (35 cm turbine, 1.3 kW peak) were installed at the eastside beach of Kandooma Island in the Maldives in May 2018, and have accumulated over 7,200 hours (ten months) of continuous operation.
(2) Two full-scale WECs (60 cm turbine, 8 kW peak) were installed in November 2018, and have accumulated over 2000 hours (three months) of operation.
(3) In February 2019, we shortly tested 1st prototype model of Ducted-WEC (taper waveguide and ducted turbine), and obtained roughly six times higher power than bare turbine.
(4) In July 2019, we installed the first full-scale prototype of the Ducted - OIST WEC at the Port of Seragaki, Okinawa. The power generation was recorded succesfully starting in September 2019.
(5) In February 2020, the turbine was found to be failed to endure the breaking wave impact. This event prompt a quick response to improve the design to ensure the survivability of the device. A newly improved Duct design was made and later installed at the same location in November 2020.
Acknowledgement
The author would like to express his appreciation to Mr. Kohei Yamashita, president of Kokyo Tatemono Co., Ltd., and Mr. Hiroshi Shimano, vice-president of Kokyo Tatemono Co., Ltd., for their support to our project through donations and various help related to the Maldives experiments. The author also wishes to give thanks to Prof. Peter Gruss, President of OIST, and Prof. Robert Baughman, Vice-CEO of OIST, for their encouragement. We would like to give thanks to Mr. Joseph Della Gatta, General Manager of Holiday-Inn Resort Kandooma, and other staff members for their support and various help. The author also wishes to thank to Ms. Yoko Shintani for her various works on contracting, exporting etc., which take a lot of patience. There are many people contributing to our project, we would like to express our appreciation for all their efforts.
References
- Tsumoru Shintake, "Harnessing the Power of Breaking Waves", AWTEC2016, Asian Wave and Tidal Energy Conference, October 24-28, Singapore 2016
- Tsumoru Shintake et al., "Technical R&D on a Surf Zone WEC", EWTEC2017, the 12th European Wave and Tidal Energy Conference 2017, Cork, Ireland, August 27 - September 1, 2017
- Hideki Takebe et al., "Water Speed Measurements at a Wave Energy Converter Test Site", EWTEC2017, the 12th European Wave and Tidal Energy Conference 2017, Cork, Ireland, August 27 - September 3, 2017
- Tsumoru Shintake et al., "Wave Energy Experiment in the Maldives", AWTEC2018, Asian Wave and Tidal Energy Conference, September 9-13, Taipei 2018.
- H. Takebe, et al., "Development of OIST Wave Energy Converter Monitoring System for Maldives Island Experiment”, Journal of Energy and Power Engineering 12(2018) 375-384.
- H. Takebe, et al., "Wave Power Measurement at Breaking Wave Zone in Maldives using Horizontal-Axis Turbine WEC”, EWTEC2019, the 13th European Wave and Tidal Energy Conference 2019, Napoli, Italy, September 2, 2019