

SoKa Project 2020 → For better bathymetry grids
Understanding the dynamics and circulation of oceans is quite a challenge while having tremendous impact on global and local environment. There exists multiple ways to approach it: from buoy releases to numerical modeling. However, whatever the method chosen, the knowledge of the bathymetry (seafloor elevation) is a keystone of the process.
On a global, there are multiple bathymetry grids available, such as the one offered by GEBCO, with resolution of about one km. However, obtaining local bathymetry at fine resolutions as required to study a reef area or lagoon is more challenging. Usually, multibeam sonars are deployed to survey areas of interest. However, this method is expensive and required a boat with a limitation on water depth accessibility.
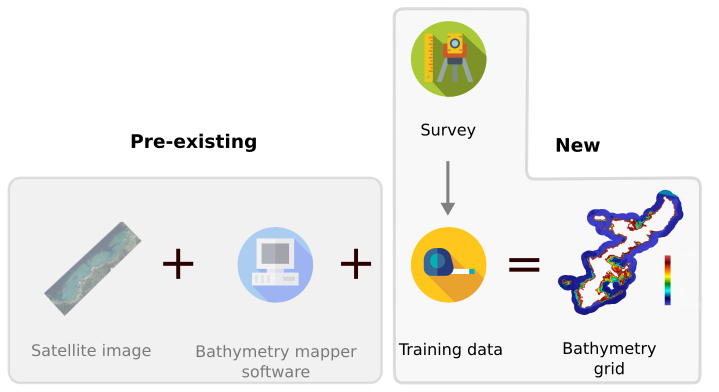
Another method, that the MBU decided to follow is to use satellite images that can be converted to bathymetry grid. Usually, a satellite based method consists of three steps, see Figure 1 : the acquisition of satellite images of the desired domain, the acquisition of training data that will act as reference for the conversion to bathymetry grids and the choice of the conversion software. In addition, some external information is added such as atmospheric and tidal correction of the satellite image depending on the chosen model and software.
During Summer 2020, MBU members decided to take the challenge to create a Satellite based bathymetry (SDB) of the Tancha lagoon, lying under OIST. To do so, some members surveyed the lagoon using a single beam SOnar mounted on a KAyak (=> SOKA project) while pressure gauges measured the tide amplitude at Seregaki port. The sonar is a fishfinder, that can be held in a hand ! The result gives a small bathymetry data-set which is used as reference during the satellite image conversion.
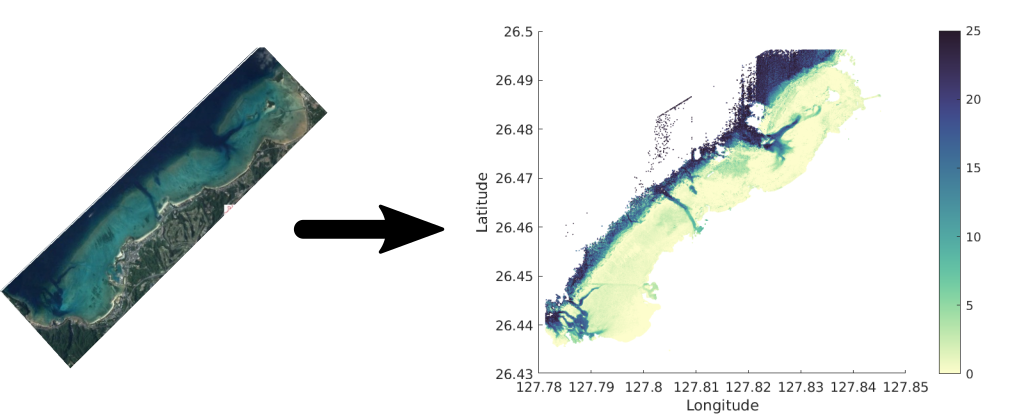
There are multiple database of satellite images with different resolution, such as Landsat (used by Google maps) or Worldview from Global-digital. Using the latter, combined with tide information from the JMA (Japanese Meteorological Association) and the Bathymapper software from JHA (Japanese Hydrographic Association), and the training data obtained during the survey, lead to a 2m resolution estimated bathymetry grid.
Before going into unknown area, this method was tested and validated in Seregaki area, where the Quantum Wave Microscopy Unit has pre-existing data. The positive results of this test allowed to apply this method and produce a new bathymetry grid for the Tancha lagoon.
To be continued around Okinawa …