

Electrocharging Face Masks with Corona Discharge Treatment
Author: Mahesh M. Bandi, Nonlinear and Non-equilibrium Physics Unit, OIST Graduate University.
This research was performed with Ms. Noriko Ishizu and Dr. Hyung-Been Kang from the OIST Engineering Support Section.
This is open-access information made freely available for anyone to use. The information provided here works for a set of operational parameters that apply to our specified designs and parts. Furthermore, this is a high voltage, high power design capable of serious harm if not handled with care. We provide no guarantee nor accept responsibility for any implementation or use derived from information provided here. The user is advised to proceed at their own discretion.
The COVID-19 pandemic has resulted in large-scale demand for N95 facepiece respirators (FRs) among essential personnel and face masks (FMs) within the larger populace. Supply chain disruptions in the pandemic's early days necessitated innovative methods to decontaminate and reuse personal protective equipment. This was especially true for single use non-woven polymer based FRs and surgical FMs, in turn leading to widespread adoption of wash-and-reuse cloth-based FMs for non-essential personnel. However, non-woven polymer electret fabrics form the mainstay for reliable filtration, especially in N95 FRs as they achieve high filtration efficiency with electrocharged filtration. Most surgical, non-woven polymer based FMs and standard cloth-based FMs do not possess this electrocharged filtration capability. Even in case of N95 FRs, repeated decontamination and re-use degrades electric charges and reduces filtration efficiency. These considerations highlight the need for methods to charge FMs or re-charge FRs and FMs in a quick and reliable manner. Accordingly, various methods such as triboelectric charging of FMs and exposing N95 FRs to high voltage electric fields have been reported.
In this webpage, we present a method to embed electric charges in a wide variety of fabrics (both natural and synthetic) using corona discharge from dielectric breakdown of air at atmospheric pressures, henceforth referred to as Corona Discharge Treatment (CDT). Our goals for this work are twofold:
1) Develop simple CDT system designs using common parts. Two designs, one using microwave oven parts and the other a neon sign power supply, are presented.
2) The ability to electrocharge non-woven, electret polymeric fabrics is well known. We wondered if knitted cloth fabrics too can be charged since most face masks out there are cloth-based. We learned it is possible to impart charges in some fabrics and within a limited range of parameters.
Background
Electrocharged Filtration
Empirical and phenomenological results inform FR and FM design to achieve efficient filtration while retaining easy respiration through three basic mechanisms. The first of them is inertial impaction whereby large particles of diameter greater than or equal to 1 micrometer deviate from flow streamlines due to inertia and impact the filter mesh and become trapped. The second mechanism applies to small particles of diameters less than or equal to 0.1 micrometer which diffuse while following flow streamlines within the porous fabric and come to rest on its fibers. The third mechanism of electrocharged filtration applies in the intermediate range of diameters 0.1 - 1 micrometers where neither inertial impaction nor diffusion are effective. Here, natural or embedded dipoles in the filtration fabric setup a static electric field around the mask layers to attract charged dust particles and aerosol droplets and trap them. Particularly in case of N95 FRs and their equivalent, the filtration standard requires such FRs to filter out 95% of particles of diameter 3 micrometers or smaller, and electrocharged filtration, together with other design features such as tight facial fit and a gap between the face and inner mask surface to improve respiration, help achieve this stringent filtration requirement.
Inertial impaction and diffusive filtration mechanisms are easily achieved by any fabric, including knitted cloth. The regularity of knitted/woven threads in a grid does reduce tortuosity of air flow streamlines which lowers filtration efficiency, but this is easily overcome by using different knit patterns for each layer and intentionally misaligning their grids between layers. However, electrocharged filtration has thus far been limited to electret polymer fabrics, with limited success from triboelectrically charged knitted or woven cloth fabrics. An easy and universal method to electrocharge any arbitrary fabric, be it natural or synthetic, knitted/woven cloth or non-woven is desirable and achievable with CDT to some extent.
Corona Discharge Treatment
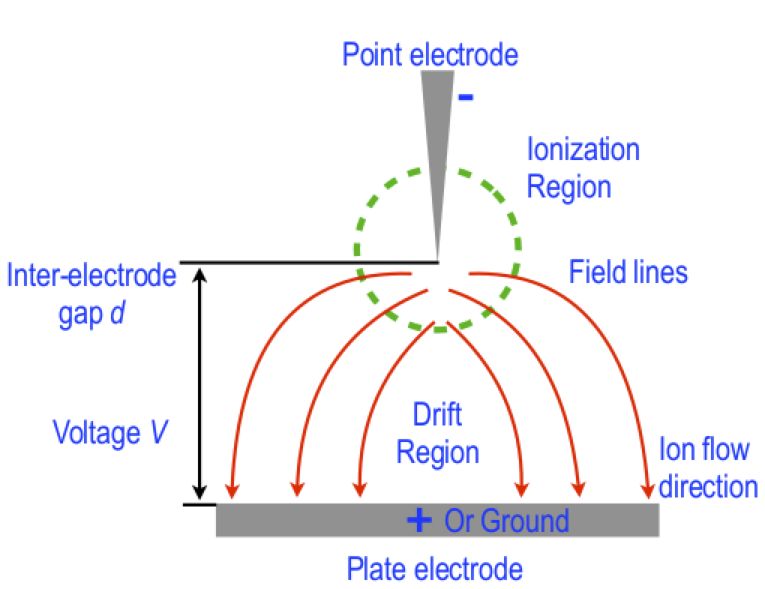
A corona discharge occurs when air or any gas is subjected to ionization within a region of space exposed to high electric fields using electrodes. Depending on the electrode polarity the corona can be unipolar (either positive or negative) or biopolar, AC or DC, or even High Frequency. Whereas some characteristics of corona discharge vary with polarity type, they all have a region where electrons collide with neutral molecules to set off ionization followed by a drift region where these ions and electrons drift towards electrodes of opposing polarity, see figure 1. Electrons with high energy collide with neutral molecules to dissociate them into electrons and ions within the ionization region. If they lose energy post collision, new collisions with neutral molecules in the drift region do not induce further ionization and the corona polarity can be maintained. If sufficiently high energy remains post ionization, these electrons and ions can react with other ionized particles resulting in plasma. Whereas a subtle distinction between corona and plasma discharges exists in that plasma is not manifest in unipolar form, both types of discharges are useful. Since the current work focuses exclusively on unipolar discharge of negative polarity, we use the term CDT to avoid confusion, although the terms CDT and plasma treatment are used interchangeably in industry.
CDT System Design
Two primary control parameters inform the design of a CDT system, viz. the threshold electric field magnitude necessary to cause ionization and the voltage - current characteristic that achieves steady-state ionization and drift. The lower bound is set by the breakdown voltage (VB), the minimum voltage at which the dielectric breakdown of air is achieved. Although no theoretical upper bound exists for the voltage, there is an upper bound for the current which saturates at a specified voltage called the saturation current (IS).
Control Parameters
Breakdown Voltage
For a specified gas, the breakdown voltage is a function only of the product of the pressure and gap distance between the electrodes, and is governed by Paschen's law. Without going into mathematical details, keeping the pressure p fixed at 1 atm (atmospheric pressure) as done in the present study, composition of the gas then determines the minimum VB and the minimal inter-electrode gap (d) at which dielectric breakdown occurs. For instance, at atmospheric pressure (p = 1 atm = 101.325 kPa), air has VB = 327 V at d = 7.5 micrometers. Since practical systems have d in the range of millimeters (e.g. spark plugs) to centimeters (e.g. textile treatment systems), a simple way to estimate VB is to lump all terms in Paschen's empirical expression (not shown here) into a single parameter. In this manner, one can arrive at a ballpark estimate by simply multiplying d in centimeters by a factor of 30000 to obtain VB ~ 3 - 30 kV for d = 0.1 - 1 cm. This range of VB informs our design of CDT circuitry, especially the transformer needed to step up the voltage fed from standard 110 or 220 V power source.
Saturation Current
Well above the breakdown voltage a stable, concentrated ionization region is setup near the active electrode and the space charge field determines the voltage-current relation of the corona discharge system. A lumped parameter analysis approaches the space charge field by treating the ionic drift region as a large, nonlinear resistor in series with the ionization region. Despite the simplicity afforded by a lumped parameter treatment, the resulting complex space-charge flow problem is captured by a nonlinear integrodifferential equation. Solutions to this equation are permissible either under extreme simplification that linearizes the problem or for special geometries possessing high symmetry. The steady-state spatial distribution of ion drift between electrodes called the Warburg distribution, when spatially integrated for a point-plate electrode geometry yields an experimentally accessible relation between the voltage V and the saturation current IS (amp) through Sigmond's approximation that also extends to wire-cylinder and wire-plate geometries. We do not present the expression from Sigmond's approximation here because current is automatically regulated by an inductive ballast in the design we present below. Calculating the saturation current is therefore unnecessary.
Ionic flow in air-based corona discharge is collision dominated, nearly all ionic momentum and energy provided by the electric field is transferred to air's neutral gas molecules. This momentum transfer renders the ionic flow viscous and causes a strong axial jet known as electric wind which is measurable and can be employed in the manipulation or extinction of flames. As an order-of-magnitude estimate, for CDT using air at atmospheric pressure with an applied voltage of 10 kV yields a saturation current in the 10s of μA range and the electric wind flows with a velocity of few m/s. If the CDT has positive polarity, nearly 95% of the input field energy is transferred to the neutral gas in the form of heat since positive ions can hardly excite neutral molecules in the drift region. However in negative polarity CDT, much higher current can pass through the gas because an increasing number of electrons can dissociate and escape neutral atoms, which in turn, excite and ionize more neutral molecules, thereby extending the ionization region further out. For this reason the electric wind for negative corona tends to have a slightly higher mean than corona of positive polarity, a fact useful in the design to follow.
System Design
We require a unipolar CDT system designed for negative polarity constructed using easily accessible parts and capable of charging a wide range of fabrics with possibly different underlying charge retention mechanisms.
Basic Circuit
The basic electrical circuit for a CDT system shown in figure2 draws its input power from a standard 110 - 220 V AC wall mount power source capable of supplying up to 10 A of current. Moving counter clockwise from the 110V AC source one could use a rating certified extension cord, leaving the end that plugs into a wall mount power socket intact and cutting the other end of the extension cord. After stripping the hot and neutral wires and ignoring the ground wire, should the extension cord have one, either the hot or neutral wire is connected to a safety switch in series to one side of the primary of a step-up transformer that raises voltage by a few 10X multiple. The easiest sources for such transformers in commonly available appliances are microwave ovens, where they are usually called MOTs for microwave oven transformers. MOTs normally step-up voltage 20X to an effective voltage of 2kV and effective current of 0.5 A, generating a peak effective power of up to 1000 W. For purposes of generating 10s of kilovolts, one can setup two MOTs in series. Note that wiring MOT or any step-up transformer outputs in series adds up voltage at constant current, whereas wiring them in parallel adds up current at constant voltage; since we seek to increase voltage, we wire the outputs in series. Wiring the primary end of the transformer is usually straightforward, but if one is not a trained electrician or lacks experience with transformers, wiring the secondary part of the transformer can be confusing. If the MOT or commercial transformer has two output wires at the secondary end then the wiring is straightforward, but some models occasionally have one side of the secondary soldered to the main body of the transformer itself. In such an event, soldering another wire to the end soldered to the transformer's main body suffiices, but it should strictly be done while the entire circuit is powered down and disconnected from the electrical mains.
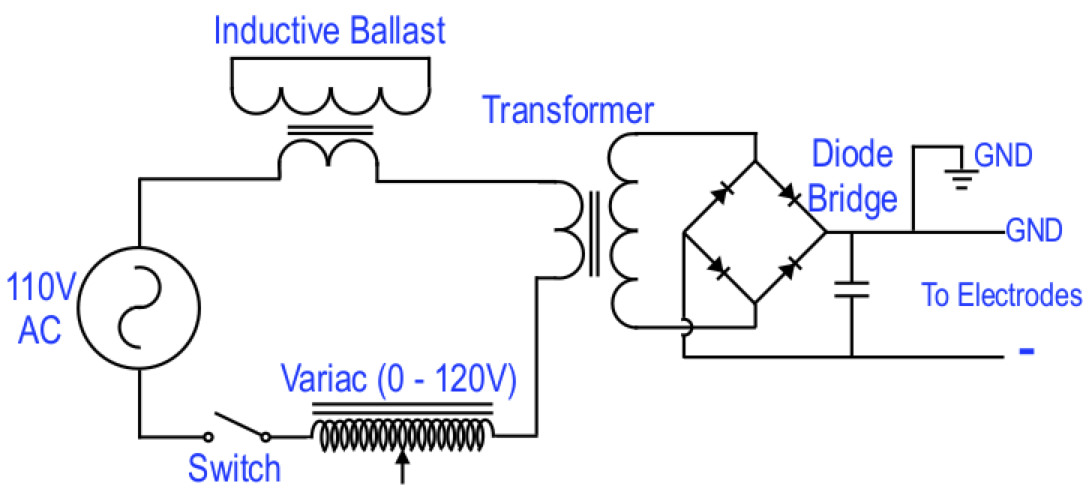
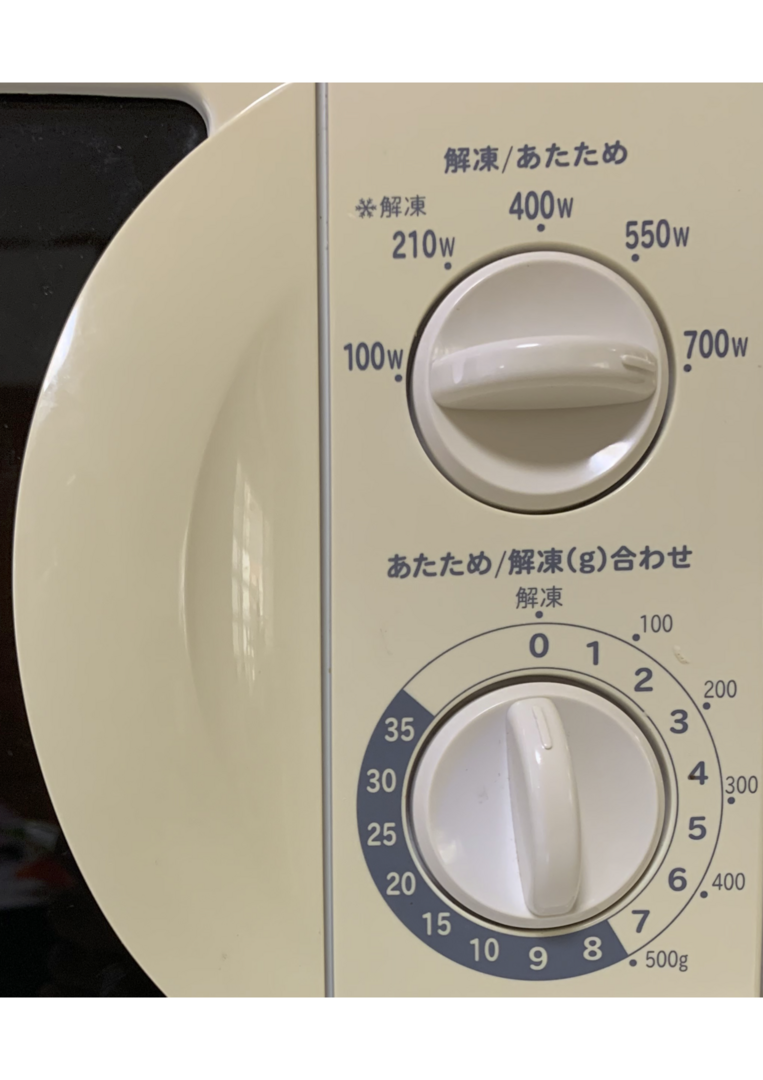
Connecting the two wires from the secondary to electrode plates is sufficient to obtain a barebones CDT system that simply steps up the output voltage and generates corona discharge. However this circuit operates in a simple on and off mode with absolutely no voltage nor current control. Addition of a variac in series with the switch and one side of the MOT's primary achieves one part of the desired control. The variac helps control the input voltage into the transformer's primary, usually in the range 0 - 120 V. Having the variac before the primary input helps control the effective peak output voltage at the transformer's secondary end by allowing gradual voltage rise from zero across VB up to the desired value. The variac also helps in experimental calibrations of optimal output voltage depending on the fabric sample we choose to work with. Finally, the variac is also a secondary safety feature that helps bring down the voltage to safe levels in case the circuit does not work to expectation. The variac is perhaps the only component that is not readily available in everyday electrical appliances. However, many models of microwave ovens come with adjustable power in discrete steps. See figure 3 for example which is a discrete step variac, it regulates power by regulating voltage at constant current. The only difference: commercial variac permits continuous input voltage variation while a microwave's regulator offers it in discrete steps. Such discrete-step regulators from microwaves suffice for CDT system if a commercial variac is unavailable.
We now connect an inductive ballast between the second wire coming off the power source to the second wire of the transformer's primary. The inductive ballast is a current limiting component that limits the current flowing across the circuit and serves two purposes. Firstly it allows the circuit to reach saturation current IS for any voltage V > VB without the need for separate current control. Secondly it serves as a safety feature by preventing the circuit from drawing too much current and potentially blowing up. The inductive ballast is just another transformer (a second MOT serves quite well) with the secondary shorted, i.e. both terminals of the secondary are wired to each other, and placed in series with the primary of the main transformer. Per the circuit presented in figure 2 one end of the the inductive ballast is connected to the power source and the other end to one end of the main transformer's primary. This completes all details for the input side of our CDT circuit.
At the circuit's output end, we have the two terminals emerging from the secondary of the main transformer. The circuit described thus far is sufficient to generate corona discharge in AC mode. Now we include a full-wave bridge rectifier, also known as diode bridge, to convert AC to DC voltage (see figure 2). The simplest way to build the diode bridge is to utilize high voltage diodes in microwave ovens; the diode bridge is usually encased with the capacitor near the magnetron system and the diodes are normally rated for 12 kV at 350 mA. Adding a capacitor, also encased with the diode bridge in a microwave oven and connecting in parallel with the diode bridge as shown in figure 2 completes the circuit. The two output terminals from the diode bridge in figure 2 then connect to electrodes to complete the CDT circuit.
Grounding the positive output terminal before it terminates in an electrode renders the CDT system unipolar with negative polarity, the grounded electrode is now passive and the CDT system is essentially an anion generator. If the positive terminal is not grounded, one obtains a balanced bipolar CDT system known as electrostatic discharge ionizers or balanced ion generators normally used to generate ozone to decontaminate surfaces. This simple design can therefore serve the dual purpose of both electrocharging PPE as an anion generator when the positive terminal is grounded and also as a plasma based surface decontamination system if the positive terminal is left ungrounded.
An even simpler and safer design replaces the inductive ballast and main transformer with a neon sign power supply (NSPS), with the remaining secondary components, viz. switch, variac, diode bridge, and capacitor connected to the NSPS. Our tests yielded identical results when we replaced the inductive ballast and main transformer in figure 2 with an Allanson SS1235ICH NSPS (peak effective voltage: 2 - 12 kV, peak current: 0.35 mA). The NSPS based CDT system encases the high voltage ballast and transformer providing relatively more operational safety to a novice designer.
The CDT design we used for the present study employed two 6.7 kV main transformers in series providing a 13.4 kV output, a regular MOT salvaged from a discarded microwave oven for the inductive ballast, and a commercial variac (Beleeb Inc. Model No.: TDGC-0.5KM, operating voltage: 0 - 120V and operating current 5A). With peak transformer voltage of 13.4 kV, we could not use salvaged high voltage microwave diodes as they were rated only up to 12 kV. Instead, we used commercial high voltage diodes (2CL2FM diodes rated for 20kV peak voltage and 100mA peak forward current and 2μA peak reverse current) and high voltage capacitor (1.05 μF from General Electric, Model No.: WB27X10701) from a discarded microwave oven. The circuit was encased in a box to ensure safe operation and the output leads were drawn from the box in a PVC tubing terminating in the electrode. Doing so allowed us to place the circuit with its heavy transformers at a stationary location and mount the electrodes on a simple linear guide rail system and expose the fabric to the output transverse jet of electric wind in a raster scan (see movies 3 and 4 below showing CDT treatment of a surgical mask).
Electrode Design
As mentioned earlier, electrocharged filtration application requires unipolar negative CDT (anion generator), but with minimal modification by ungrounding the positive electrode this same system becomes an ozone generator for decontamination of PPE. Whereas the present study does not explore PPE decontamination with this CDT system run in plasma mode, we inform the interested reader of this possibility. Typical textile plasma treatment systems place the sample between the electrodes whereby the air surrounding the active electrode breaks down to generate the desired ions, which then drift through the cloth sample in trying to reach the electrode of opposing polarity, and perform the desired treatment to the cloth sample's surface.
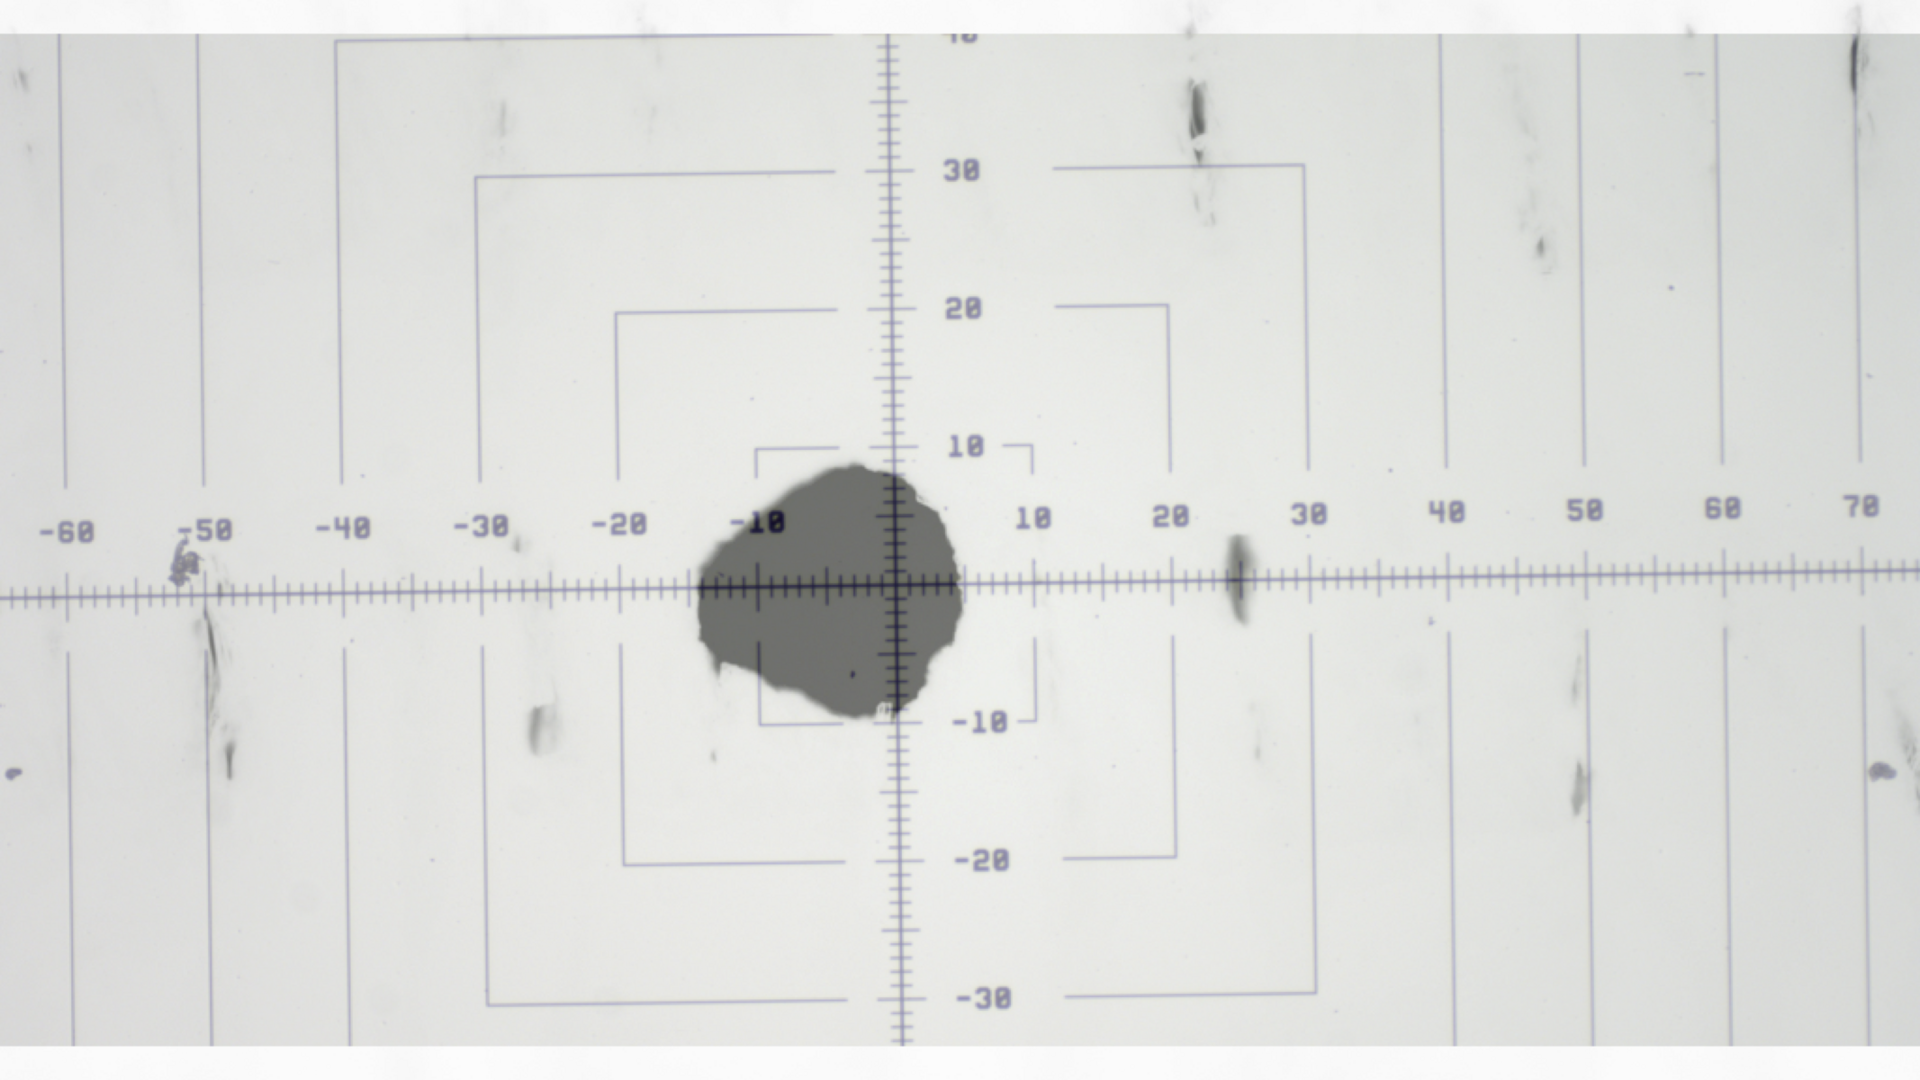
Given our goal is to embed negative charges on the fabric and not perform a permanent treatment, we follow a different design. Unipolar negative corona systems with point-plate geometry initially generate a pulsed corona known as Trichel pulses, followed by pulseless corona which eventually terminates with a spark discharge with increasing voltage. This implies there is no escape from high energy sparks which, in the process of reaching the opposite electrode, intrude the fabric sample and damage it with small pinhole burns (see figure 7 for an exemplar). We also need a large enough inter-electrode gap (d) to permit a drift region and an electric wind.
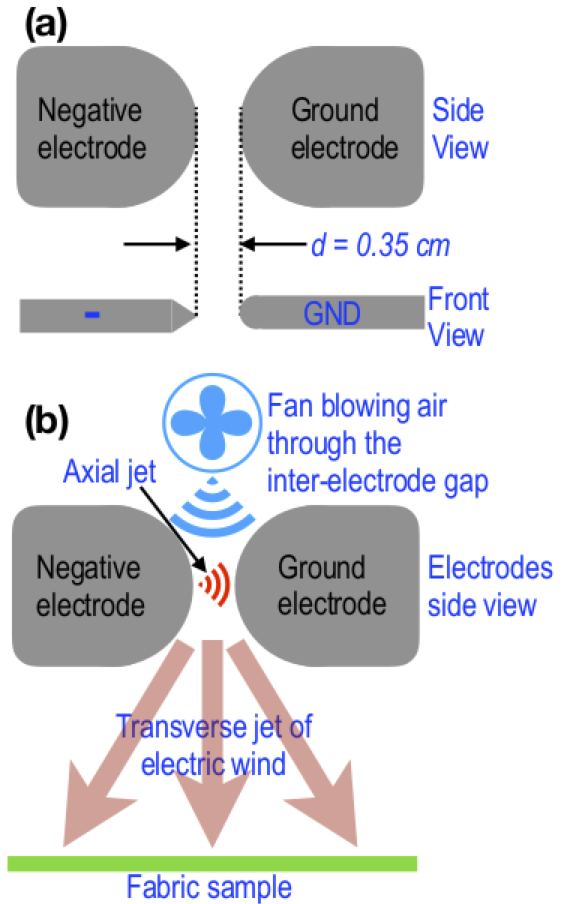
We designed electrodes that mimic wire-cylinder geometry with a curvature as shown in figure 4a. The two electrodes were cut from tool steel of 1.5 mm thickness in a semicircular geometry as shown in figure 4a (side view) but one of them (negative electrode) was filed to have a sharp tapered edge while the second electrode (ground) had a smooth semicircular edge thereby creating a design analogous to a wire-cylinder geometry. The inter-electrode gap was set to d = 0.35 cm at the nearest point between the electrodes where the field intensity would be maximum, thus translating to a requirement of approximately VB ~ 10.5 kV, well within our design range. Air was blown from behind the electrodes with a centrifugal fan to reorient the axial jet traversing from the negative to ground electrode along the transverse direction (see schematic in figure 4b). The semicircular electrode geometry allowed the corona discharge to smoothly slide along the electrode surface and eject a strong transverse jet of electric wind as shown in figure 5b, also see movies 1 (30 fps) and 2 (240 fps) of the corona discharge exiting the electrodes. There the trichel pulses can be heard as semi-periodic clicks, the sparks can be observed at the nearest inter-electrode gap and a flame-like blue glow diffuses and spreads out under influence of the air blown from the centrifugal fan. The fabric samples were exposed to this transverse corona jet for electrocharging purposes.
Movie 1: Corona discharge observed with bare electrodes (confining plate removed) at 30 frames per second.
Movie 2: Corona discharge in slow motion at 240 frames per second. The Trichel pulses of the negative corona can be heard as semi-periodic clicks.
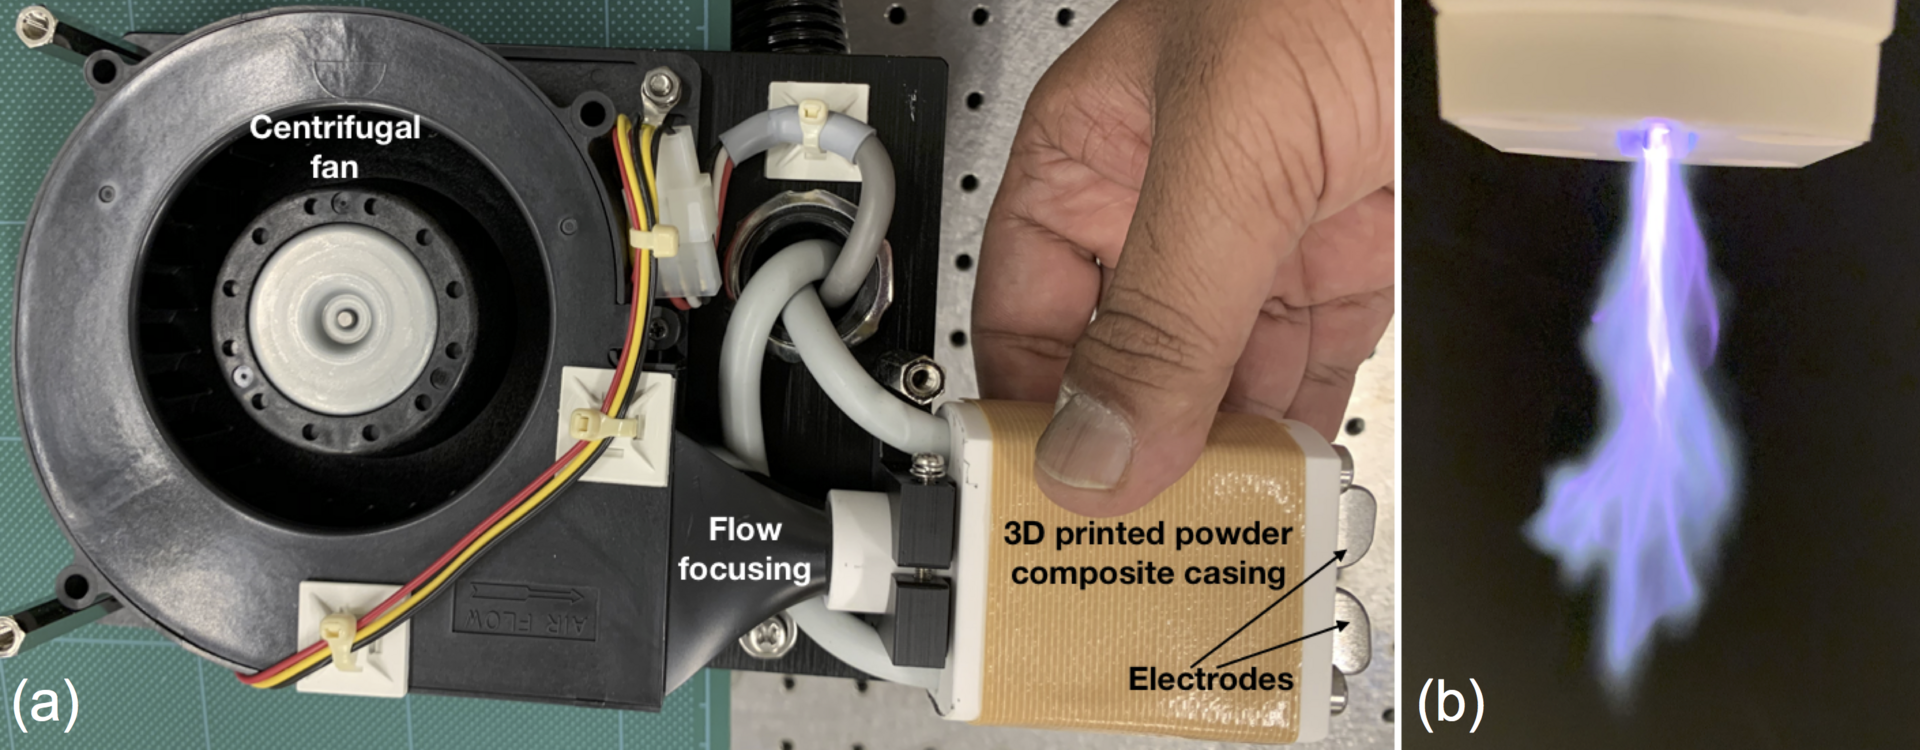
In practice, the electrodes were mounted at one end of a 3D printed powder composite casing and a flow focusing nozzle at the other end. The casing was 3D printed using ProJet 460Plus from 3D systems and a component infiltrate (Colorbond) was applied to provide additional strength to the powder composite (Visijet PXL Core) combined with a binding agent (Visijet PXL). The powder composite has high thermal and electrical insulation properties as opposed to standard ABS thermoplastics which deform and melt under the heat generated from corona discharge. The nozzle focused the air exiting the outlet of the centrifugal blower fan as shown in figure 5a from actual construction. The focusing nozzle therefore increased flow rate as it approached the electrodes. Finally, for safety reasons a 3D printed powder composite plate with a tapered slit was mounted onto the casing to enclose the electrodes such that the transverse jet of the corona discharge exited through the slit. Albeit highly unlikely, to avoid electrical contact from dielectric breakdown of powder composite, four plastic (instead of metallic) screws were used to mount the powder composite plate on to the powder composite casing. The resulting transverse jet of the corona discharge was observed as jet exiting the slit in the powder composite plate as shown in figure 5b (also see movie 1 at 30 frames per second and movie 2 at 240 frames per second without the powder composite plate and exposing the electrodes).
Characterization
The basic treatment protocol is quite simple as long as due caution is exercised. The treatment process merely involves placing the fabric on a clean, flat surface with the CDT system electrodes facing down onto the fabric's top surface and turning on the CDT system to generate ions for a sufficient duration until the fabric is electrocharged. In practice, one must determine some operational parameters such as optimal distance between the electrodes and fabric and the treatment duration. These operational parameters depend upon the applied voltage and centrifugal fan's air flow rate, both of which determine how far the discharge sparks and glow extend as well as the mean ion flux from electrodes to the sample. Since both voltage and the air flow mechanism will definitely with implementation, users are encouraged to perform characterization on their implementations.
Structure
Since our aim is to achieve repetitive electrocharging of FRs and FMs, it is necessary that the CDT treatment does not cause irreversible structural changes to the fabric. Whereas one form of structural change arises from fabric degradation due to discharge sparks or heat, another occurs from the usual treatment in textile industry which changes the nature of bonds on fabric surfaces, both of which we wish to avoid. Since structural degradation in non-woven polymer fabrics used in FRs and surgical masks is different from knitted cloth fabrics, we explain both situations separately.
Non-woven Polymer Fabrics
FRs and surgical masks normally employ meltblown polymers as filtration layers (with and without electrocharging). Please note, surgical masks are also made from polycotton, such masks are not suitable for the CDT electrocharging method. Whereas only the middle layer in FRs tends to be electrocharged, the outer layers of FRs as well as all layers of surgical masks are capable of being electrocharged as well. This capability is owed to the fact that polymeric materials such as polypropylene and polystyrene are electrets, i.e. capable of holding static charge through induced or oriented dipoles, easily achieved post-fabrication by exposing the fabrics to either an external electric field or CDT, commonly referred to as isothermal charging. Due care must be observed when using CDT so as not to expose fabrics to sparks or heat generated by the discharge for they most certainly degrade fabric structure.
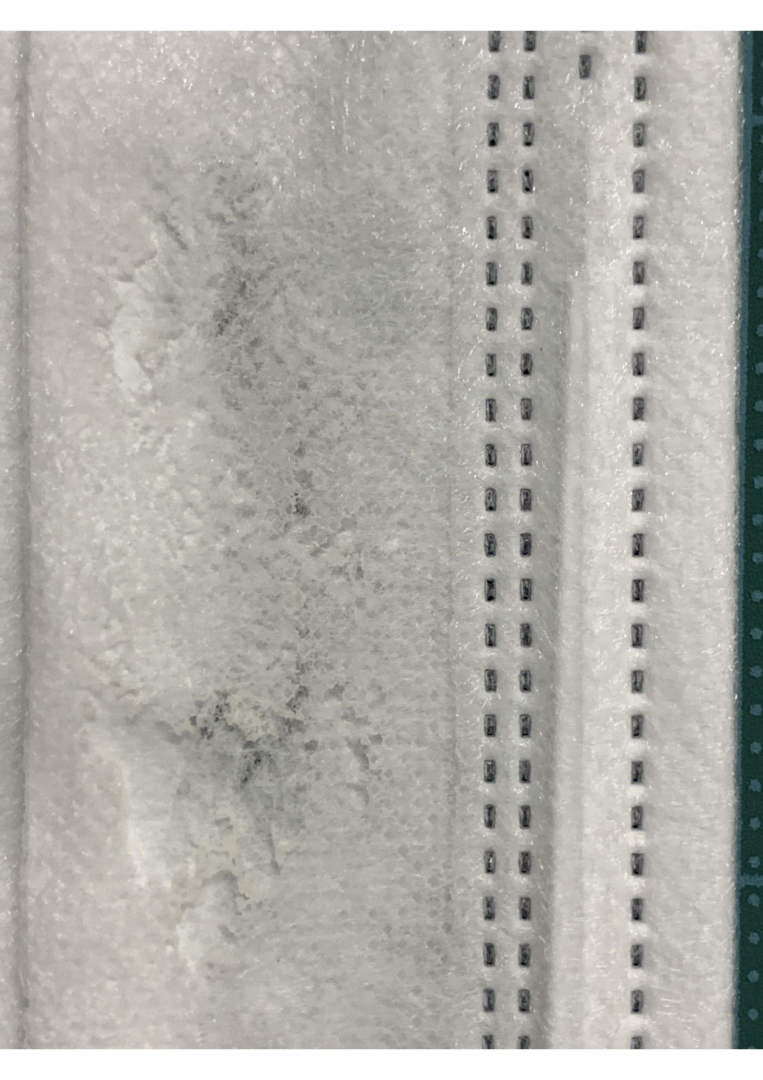
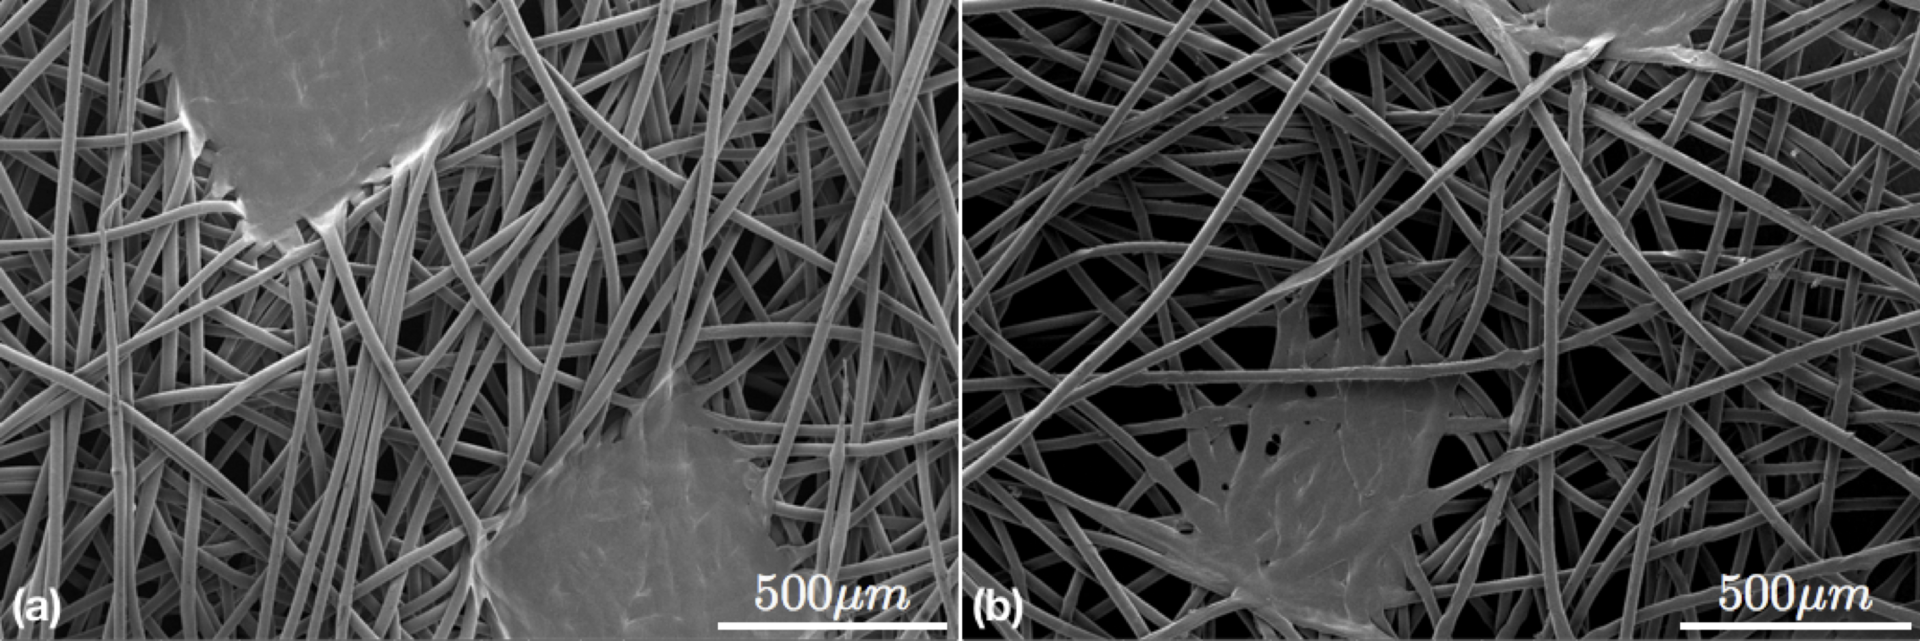
Isotactic Polypropylene has a melting temperature of 160 - 165 oC whereas Polystyrene has a glass transition temperature of 100 oC. As a result surgical masks readily melt if directly exposed to the high temperature corona discharge as demonstrated in a deliberate example shown in figure 6 (also see movies 3 and 5). For this reason FRs and surgical masks should never undergo CDT in direct contact with discharge sparks. Even when the discharge does not contact FRs and surgical masks, the transverse electric wind transporting the ions can be sufficiently hot if the distance is not large enough and result in surgical mask degradation at the microscopic level through local melting or fraying of polymer strands. As an exemplar, figure 7 shows scanning electron micrographs for the same surgical mask pre-CDT (figure 7a) and post-CDT (figure 7b, also see movies 4 and 6) where the discharge sparks and glow are only 3 cm distant from the surgical mask surface.
Movie 3: Surgical mask undergoing CDT at 3 cm vertical distance results in microscopic local melting as can be seen with the scanning electron micrographs presented in figure 7b.
Movie 4: Surgical mask undergoing CDT at 7 cm vertical distance yields proper results without structural damage.
A simple solution to avoid heat induced degradation of FRs and surgical mask would be to place the electrodes sufficiently far from the mask surface, but ion flux to the mask decreases as the distance between mask and discharge increases due to divergence of the transverse electric wind. A minimum distance exists at which the masks no longer degrade under heating while receiving sufficient ion flux. This was determined empirically by measuring the temperature field in the vicinity of surgical masks undergoing CDT using a Medium Wave Infra Red (MWIR) camera. Movies 5 - 7 show heat maps obtained for the same surgical mask under identical conditions, except the vertical distance between surgical mask and discharge spark and glow of 1 cm (Movie 5), 3 cm (Movie 6) and 7 cm (Movie 7). Please note that the heat map's color spectral range is identical but they represent different temperature ranges, numbers are provided below.
Movie 5: Thermal imaging for CDT of surgical mask with discharge making contact with mask resulting in figure 6.
Movie 6: Thermal imaging for CDT of surgical mask with discharge 3 cm above mask resulting in figure 7b.
Movie 7: Thermal imaging for CDT of surgical mask at 7 cm vertical distance.
A surgical mask undergoing CDT at the vertical distance between mask and discharge glow of 1 cm (movie 5) results in the mask shown in figure 6. At a vertical distance of 3 cm (Movie 6) and 7 cm (Movie 7) we do not see any visible differences on the mask surface. However, the same two situations when interrogated with MWIR camera clearly show the surgical mask attain temperatures in the range 100 - 110 oC for 3 cm vertical gap as opposed to 7 cm vertical gap showing mask surface temperatures of approx. 65 - 75 oC. A surface temperature of 100 - 110 oC at 3 cm vertical gap is sufficient to locally melt the fabric. We also draw the reader's attention to the fact that the transverse electric wind can be observed as minor temperature fluctuations in the spatial region between the mask sample and discharge in the thermal imaging movies 5 - 7. The vertical distance of 7 cm was empirically determined to be the minimum safe working distance.
Knitted Cloth Fabrics
FMs made of knitted cloth, natural or synthetic, also undergo structural degradation under direct discharge contact, but for reasons different from non-woven polymeric fabrics. Knitted cloth fabrics tend to locally burn by singeing threads and do not melt. This is observed as a spontaneous yellow flame from a burning thread and is spectrally distinct from the blue corona discharge glow, see Movie 8. These singes cause microscopic damage by burning individual threads that loosen the knit and consequently increase pore diameter whose dimension is essential to filtration efficiency.
Movie 8: Yellow flashes observed when blue discharge glow contacts cloth mask causing local thread burns.
Finally, a third form of change occurs when the CDT discharge glow is at a distance of 1 - 3 cm from the knitted cloth FM surface. To call it a structural change would be a misnomer since it involves production of functional groups on cloth fabric surface when the active species such as free radicals generated by the air ionization react with atoms or molecules on the fabric surface. This process is often researched in textile surface treatment methods and usually does not result in any perceptible structural changes in the fabric, but rather in their functional properties, such as non-wrinkling or fire resistance. These functional groups can be detected via Fourier Transform Infrared (FTIR) spectroscopy through comparison between two identical fabric samples, one of which is untreated and the other is. Our FTIR spectrometer (Manufacturer: Bruker, Model: Vertex 80V) was operated in attenuated total reflection (ATR) sampling mode using a diamond anvil to explore the fabric's surface characteristics. The transmittance measured in ATR units was obtained as a function of the input energy supplied in wavenumber units (cm-1).
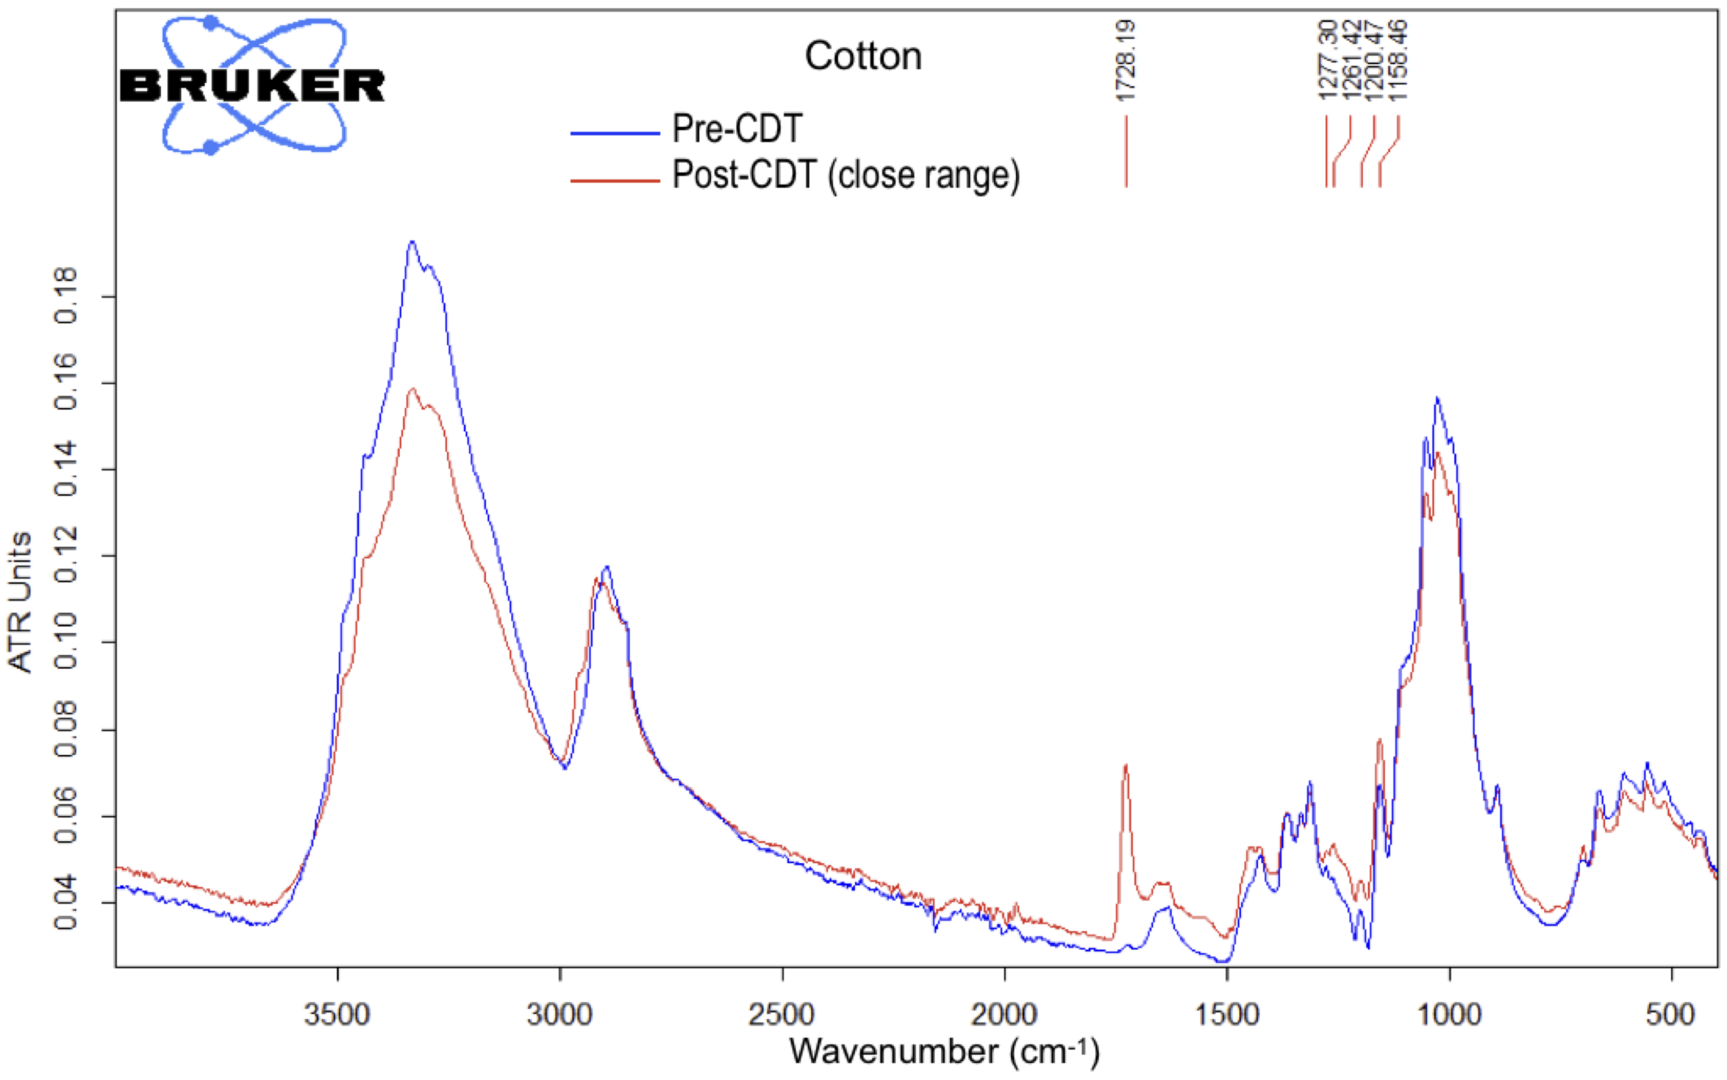
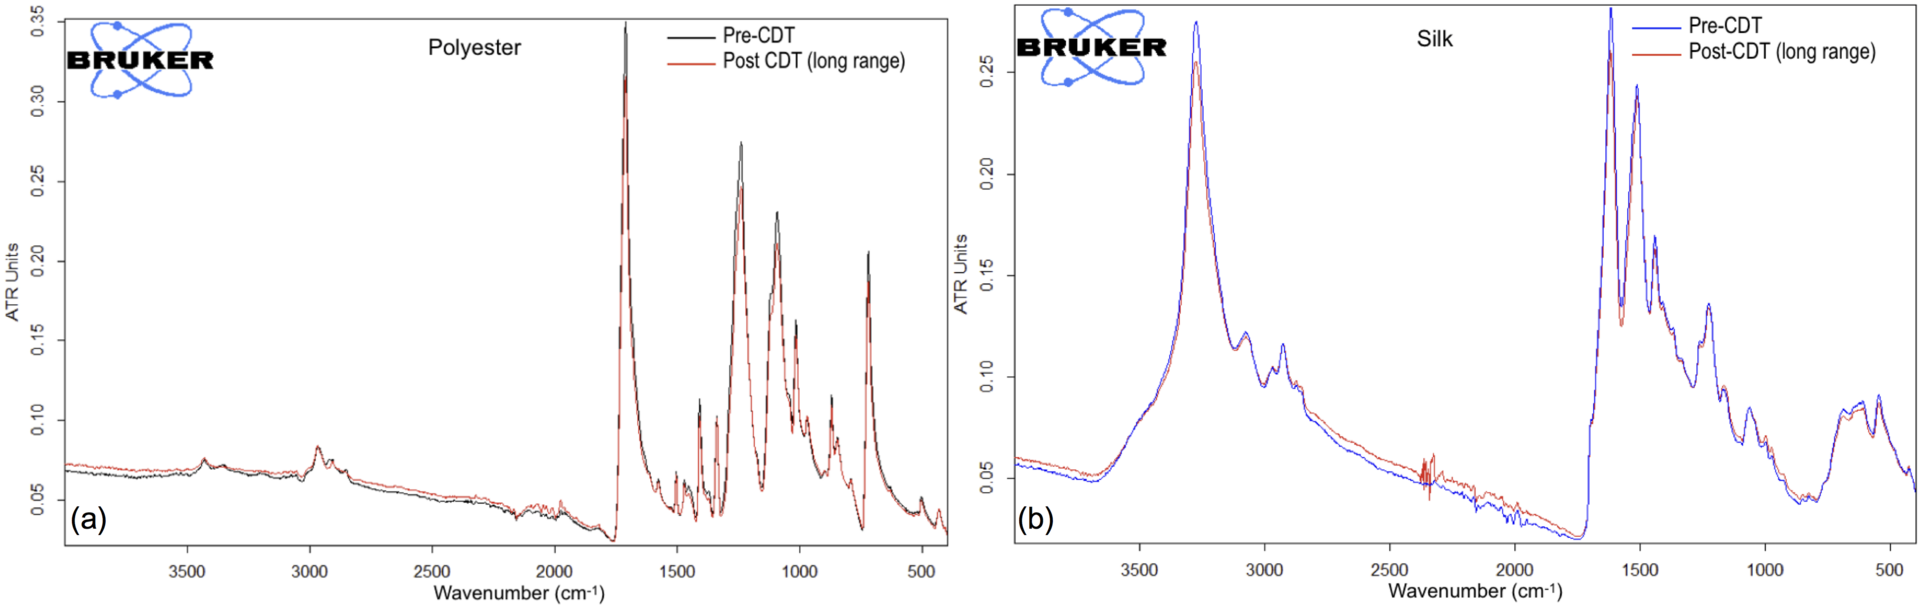
Figure 9 presents a representative result for cotton fabric samples without (blue curve) and with CDT (red curve) performed at 3 cm distance between discharge glow and fabric sample. The most perceptible difference is the presence of a peak for post-CDT sample at 1729 cm-1 absent in untreated sample and minor peaks in the 1158 - 1278 cm-1 range that are suppressed in the untreated sample. These particular differences in the specific case of cotton are known to coincide with the presence of (C=O) bond at 1720 cm-1 and (C-O) functional group in the 1080 - 1300 cm-1 range. This reactive functionalization is not observed when the discharge is more than 3 cm from fabric surface. Rather than cotton, in figure 11, we present pre- and post-CDT results for samples of knitted polyester (figure 11a) and silk (figure 11b) with distance between sample and discharge set at 5 cm. The two results for pre-CDT (blue curves) and post-CDT (red curves) are nearly identical, in particular no new peaks are observed.
Our tests on knitted cloth fabrics with discharge - fabric vertical gap varied in steps of 1 cm each revealed an optimal working distance range. As explained above, at short distance fabrics degrade structurally when the discharge glow and sparks come in contact with fabric. At vertical distances above 5 cm we did not measure any charges imparted to fabric samples. In an intermediate range of 3 - 5 cm discharge - fabric vertical distance we could measure charges, but the measured charge exhibited exponential decay in time where the decay time constant varied over a wide range from a couple of minutes (e.g. cotton, silk) up to hours (e.g. polyester, Nylon) depending on fabric type. At the outset, we were not expecting CDT to charge knitted cloth fabrics and the discovery of a limited range of working distance where charge retention occurs for some, but not all, cloth fabrics was very encouraging.
Charge Measurements
CDT and Charge Measurement Protocol
Following our surface characterisation studies, all non-woven polymer samples were treated at electrode - sample gap of 8 cm, whereas knitted cloth samples were treated at 4 cm. The CDT system was operated above its breakdown voltage (VB ~ 10.5 kV) at 12 kV for improved ion flux at these operating distances, with the inductive ballast regulating current to attain its saturation value. There was sufficient ion flux to operate the linear guide rail holding the electrodes at 1 cm/s translation speed for charge saturation in fabrics we empirically found capable to retaining charges. Fabrics which we concluded incapable of charge retention were exposed to CDT for as long as 10 minutes with no measurable charge retention.
We performed our electrostatic charge measurements with a non-contact electrostatic potentiometer (KSS-2000 Digital Electrostatic Potentiometer, Manufacturer: Kasuga Denki Inc.) with a piezoelectric transducer capable of measuring electrostatic voltage at a distance of 50 - 100 nm from the sample. The potentiometer was connected to a laptop via USB interface for automated data acquisition. During preliminary measurements, we noticed a confounding drift towards higher values in potentiometer readings after the first few minutes, which we isolated to charge accumulation on the sensor from prolonged exposure to the fabric. This measurement anomaly was rectified by resetting the potentiometer before each measurement, which resulted in more reliable measurements; all measurements we report here follow this protocol.
Charge Measurement Results
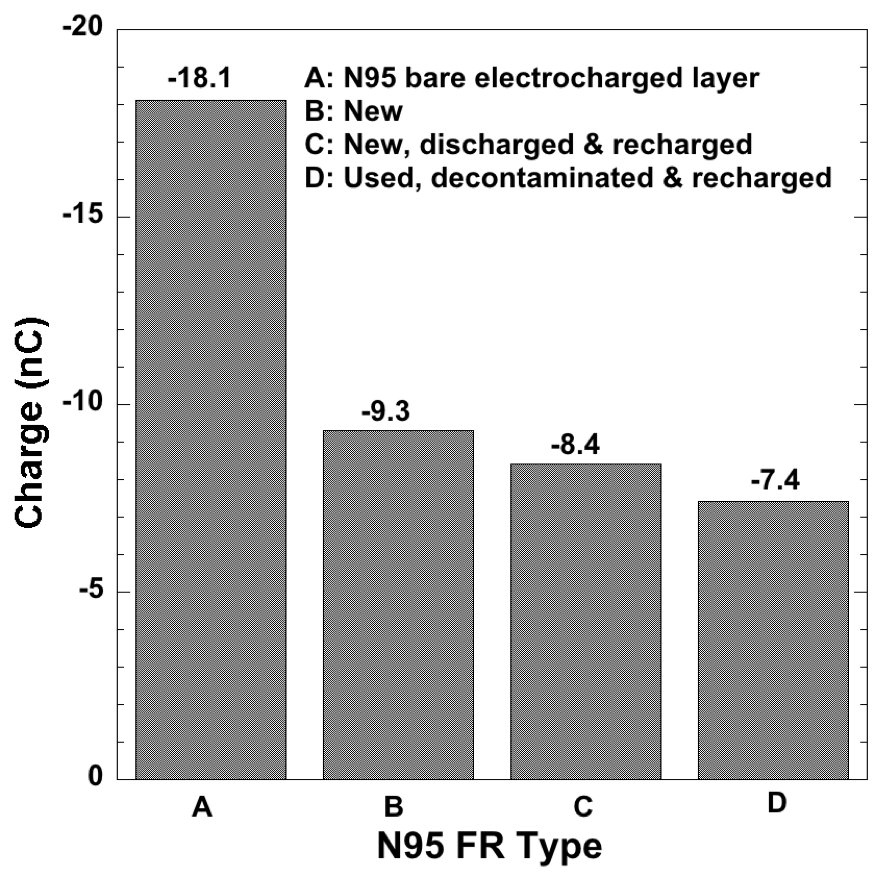
N95 FRs are the most widespread PPEs in use with electrocharged filtration layers, hence form the baseline comparative standard against all other fabrics. Our results therefore begin with charge measurements performed on N95 FRs and are detailed in figure 11 for charge (in nano coulombs, nC) obtained from a single sample. Given the N95 FR's electrocharged layer lies sandwiched between outer non-electrocharged fabrics, charge measurement on the N95 FR's outer surface is bound to be lower than one measured directly on the electrocharged layer due to distance separation as well as the outer layer's presence as a dielectric barrier. Indeed, the charge recorded for a bare electrocharged layer (Type A in figure 11) is nearly twice the value recorded at a new N95 FR's outer surface (type B in figure 11). Post measurement, this new N95 FR was depleted of its charge by soaking it in ethanol, dried, and then exposed to exhaust from a balanced ion generator (CDT in bipolar mode). After confirming the presence of no net charge, this N95 FR was recharged using CDT to simulate a used, decontaminated, and recharged FR (type C in figure 11). From this baseline test, we learned recharging comes close to, but never quite restores N95 FRs back to their pristine charge values. As a control, a used and decontaminated N95 FR was also recharged via CDT protocol (type D in figure 11). The discrepancy of -1 nC between the type C and type D N95 FRs may be due to trapped particles and bioaerosols screening the charge in type D, but absent in type C.
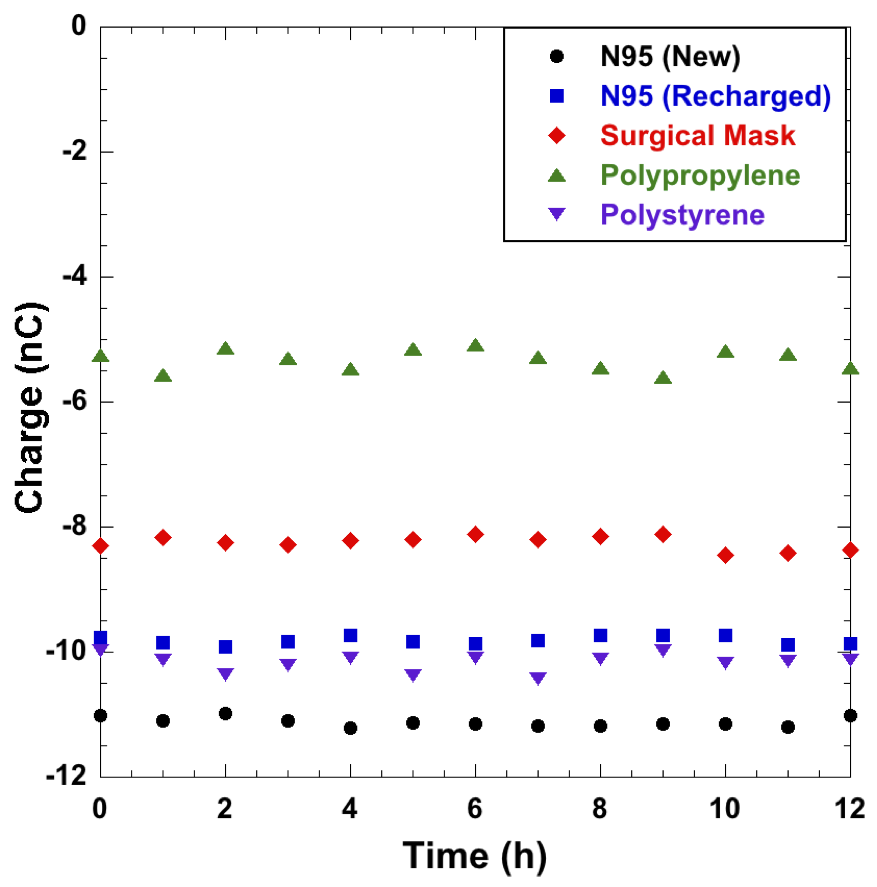
Polymeric electret fabrics are charged through oriented dipoles within the polymeric material and ideally retain their charge for as long as the electret fabrics are properly packaged and stored. Whereas we expect the same for CDT recharged N95 FRs, it is not guaranteed and begs testing to this end because the instantaneous measurement in figure 11 does not inform us of charge decay and asymptotic steady charge values, if any. Readings were therefore obtained for commercial electret fabrics, both recharged (N95 FRs) and charged (surgical masks) for the first time. Charges recorded at 1 hour intervals for a 12 hour duration (see figure 12) did not reveal any discharging, nearly steady charge was observed for a new N95 FR (black solid circles), intentionally depleted and CDT recharged N95 FR (solid blue squares), and a new surgical mask CDT charged for the first time (solid red diamonds). As a further test, non-woven polypropylene (upright solid green triangles) and polystyrene (inverted solid purple triangles) manufactured in-house using the cotton candy principle and subjected to CDT process recorded steady values of as well. All these samples when wrapped in mylar and stored for 2 weeks still retained the same charge levels. We were therefore assured that these electret fabrics were charged by orienting the dipoles embedded in the polymeric material. This is not the case with knitted cloth fabrics as we see shortly.
Triboelectric charging is the only route by which knitted cloth fabrics are known to gain charge, a technique known since antiquity but whose fundamental mechanisms are only just beginning to be elucidated. Applying the CDT method on knitted cloth samples, only few and not all fabrics possess the ability to take up charges, the underlying reason of which is unknown to us at this time. Among those fabrics that we were able to charge, we found wide variability in their ability to gain charges in the first place as well as retain them. Unfortunately, some of the fabrics most commonly employed in FMs such as cotton, silk, and linen did not take up charges under any of the varied circumstances we explored, including CDT for up to 10 minutes. Some fabrics, both natural (natural biodegradable polyester and cellulose) and synthetic (nylon, polyethylene terephthalate -- PET and polyphenylene sulfide -- PPS) were able to take up charges under CDT. Figure 13 below shows charge measurements at 15 minute intervals for knitted cloth samples over a 12 hour duration. All knitted fabrics (natural or synthetic) exhibit an early peak charge value that relaxes over a wide time period to a steady value, which too varies widely. All peak charge values (in nC), decay time (in hours) and the asymptotic steady value (in nC) are tabulated in table 1 below.
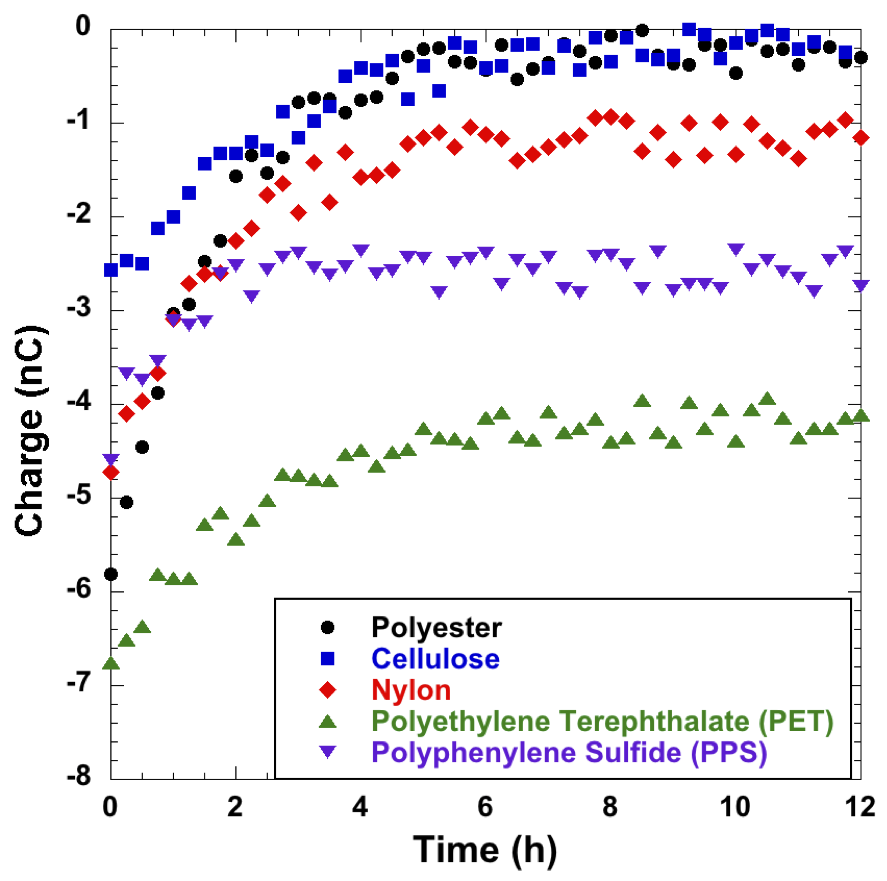
| Fabric | Peak charge (nC) | Decay time (h) | Steady value (nC) |
|---|---|---|---|
| Cellulose | -2.6 | 6 | 0 |
| Polyester (natural biodegradable) | -5.8 | 5.5 | 0 |
| Cotton | 0 | 0 | 0 |
| Silk | 0 | 0 | 0 |
| Linen | 0 | 0 | 0 |
| Nylon | -4.7 | 3.5 | -1.1 |
| Polyethylene Terephthalate (PET) | -6.9 | 7 | -4.2 |
| Polyphenylene Sulfide (PPS) | -4.5 | 1.5 | -2.6 |
Since the ability to electrocharge cloth fabrics is the main focus of the present work, we relegate explorations in fundamental mechanisms of charge uptake to future exploration. Be that as it may, a few observations are immediately gleaned from figures 12 and 13. Whereas non-woven, electret, polymeric fabrics exhibit steady charge retention from orientation of embedded dipoles, knitted cloth samples exhibit an initial peak charge that relaxes over hours to an asymptotic steady value that can be as low as 0 nC. This points to a fundamentally different charge uptake mechanism in knitted cloth. Polymer electret cloth fabrics such as PET and PPS which asymptote to a reasonably high charge value of -4.2 and -2.6 nC respectively, still exhibit early time relaxation from a peak value; the asymptotic non-zero charge most likely arising from orientation of embedded dipoles. These observations taken together are consistent with an ion adsorption onto the fabric surface in knitted cloth with the post-CDT charge relaxation indicative of a desorption mechanism. To this end, one naturally expects that the fabric's composition, its treatment prior to CDT process, nature of dye molecules present, will all play a role and inform material parameters worth studying. An illustrative example is provided by a comparison of polyester and polyethylene terephthalate (PET). Whereas the polyester fabric we used was spun from natural, biodegradable yarn it is chemically close to PET. Indeed, PET often forms the base material for synthetic polyester yarns. Yet the two fabrics display markedly different charging behavior. Whereas the natural, biodegradable polyester fabric had a high initial peak charge value, it completely discharges to 0 nC over ~5.5 hours. On the other hand knitted fabric spun from PET yarn, possessed a higher initial peak charge relative to polyester and still retained the highest asymptotic charge value after 12 hours.
Filtration Test
Setup
Our filtration tests were performed on a setup designed in-house originally to test electrocharged fabrics manufactured using the cotton candy principle. Full details of the setup, especially design shortcomings that do not conform to NIOSH certification standards, are available in the published manuscript, parts of which are posted here.
Filtration tests for face mask certification are usually performed on specialized equipment such as the Portacount Respirator Fit-Tester and MITA 8120, both from TSI Inc. or AccuFIT 9000 from Accutec-IHS Inc. Lacking access to such special testing systems, a filtration testing system was designed in-house as shown in figure 14. A manikin head used in retail store fronts was drilled with a hole from its mouth to the back of its head. The face mask under test was then mounted onto the manikin head's face and placed in a confining box. The mask was taped along its perimeter to the manikin head to prevent unfiltered air from leaking through. An inexpensive piezeoelectric atomizer (APGTEK Aluminum Mist Maker) usually employed in home decoration was submerged in Sodium Chloride solution (5\% by weight NaCl in de-ionized water) to generate aerosol particles. The mist could pass through a pipe with a second connecting pipe open to ambient air as shown in the schematic and both pipes had valves to help control the total aerosol concentration in the air entering the confining box.
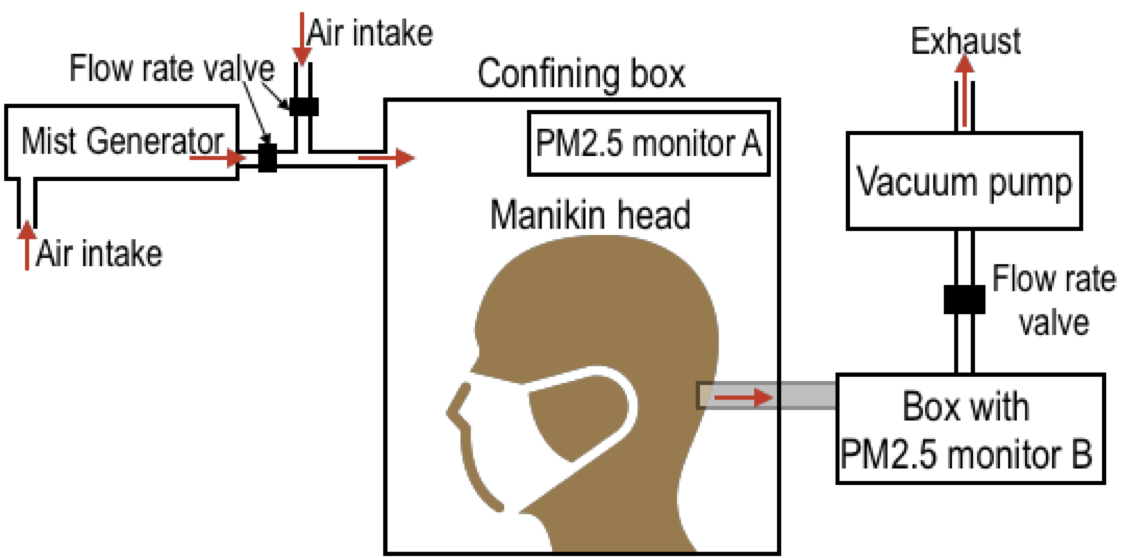
A portable PM2.5 air quality monitor (Manufacturer: Dienmern) used normally for home and office air quality monitoring was placed in the confining box (Monitor A in figure 14) to measure the particle concentration within the box. By reading this PM2.5 monitor, the two inlet valves were adjusted for aerosol mist and ambient air to control aerosol concentration in the confining box. The back of the manikin head was connected to a pipe which exited the confining box and terminated in a box containing a second PM2.5 air quality monitor (Monitor B in figure 14). This monitor gave reading of particles that had passed through the fabric and manikin mouth and allowed measurement of filtration quality. This box containing the second PM2.5 monitor was, in turn connected to a vacuum pump as shown in the figure above. When the vacuum pump was turned on, a suction pressure was felt in the confining box and aerosol particles mixed with ambient air were sucked into the confining box and passed through the face mask to enter the drilled hole in the manikin head and exited the confining box. By controlling the vacuum pump valve, one was able to simulate flow rates for normal (30 liters per minute) and high (85 liters per minute) respiration rates. All filtration tests in this study were performed at 30 liters per minute flow rate.
All filtration tests were conducted under the following prevailing conditions. The lab temperature was maintained at 23 oC +/- 2 oC and relative humidity of 43%. The relative humidity within the filtration test setup's confining box was however higher due to aerosol presence at 58%. The area of fabric samples used for face masks was 9 cm x 16 cm. The aerosol number concentration at 30 L/min flow rate was 1.7 x 10⁸ particles per cm3 providing high enough aerosol concentration.
Filtration Test Results
FR filtration efficiency is usually measured in terms of the penetration percentage (P), defined as percentage of particles present in the environment that pass through the FRs and is quoted against the particle diameters. Since particle sizes could not be measured by the PM2.5 monitors we employed, the penetration is instead defined as:
\(P(t) = \frac{C_B(t)}{C_A(t)} \times 100\%\)
where CA(t) and CB(t) are the particle concentrations of PM2.5 monitors A and B respectively at time t. The penetration as a function of time was followed to study any deterioration in filtration properties. The PM2.5 monitors A and B were connected to a laptop and programmed to record concentration values at 15 minute intervals over a duration of 12 hours. Under this measure, filtration efficiency is 100% - P(t), i.e. the NIOSH mandated N95 standard conforming to 95% filtration efficency is equivalent to 5% or less penetration.
Commercial N95 FRs and surgical masks were used as is for the tests, whereas cloth masks were prepared from constituent fabric material with three layers. CDT treatment on all FRs and FMs was performed only on the outer layer exposed to the environment, not the inner layer that comes in contact with the face. All FRs and FMs were taped to the manikin head to negate all possibility of air leakage through interstitial gap between mask and manikin face. Filtration tests performed included one with a new commercial N95 FR to serve as the standard against which to measure all test results. A second test was performed with N95 FR that was discharged (ethanol soaked, dried, and exposed to balanced ion generator) followed by recharging with CDT. All filtration tests on surgical and knitted cloth FMs were performed in the natural uncharged (control test), and post-CDT charging so as to obtain comparison with the same material.
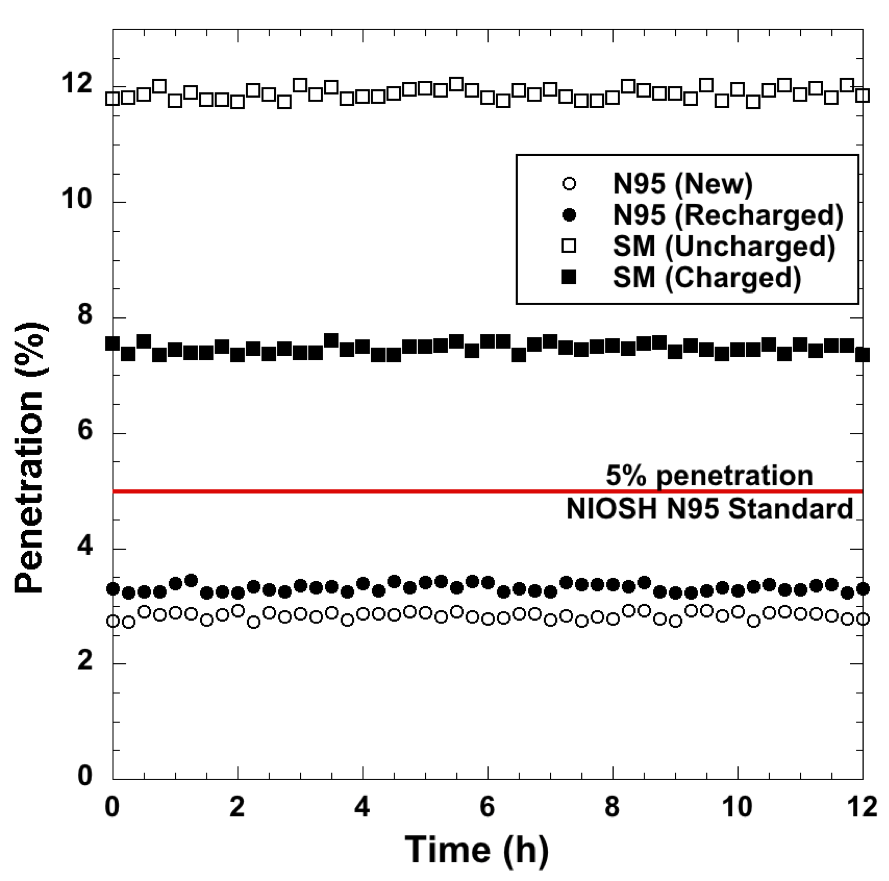
In figure 15, we first present filtration test results for N95 FRs and surgical masks from non-woven, electret, polymeric fabrics, which exhibited the isothermal charging route to electrocharging (see figure 12). The 5% penetration value for NIOSH mandated N95 standard is marked as a red line, implying all data that falls below this red line conforms to the N95 standard, and all data above does not. As expected, a new (previously unused) commercial N95 FR as well as a new commercial N95 FR intentionally discharged (by ethanol soaking, drying, and exposure to balanced ion generator) and then CDT recharged performed within the N95 standard. Standard surgical mask (SM) pre-CDT yielded a penetration value around 11.8% well above N95 standard as expected. However when CDT charged, the same surgical masks performed much better with a penetration value ~7.45%. Whereas this still does not conform to N95 standard, it is a considerable improvement over an uncharged SM.
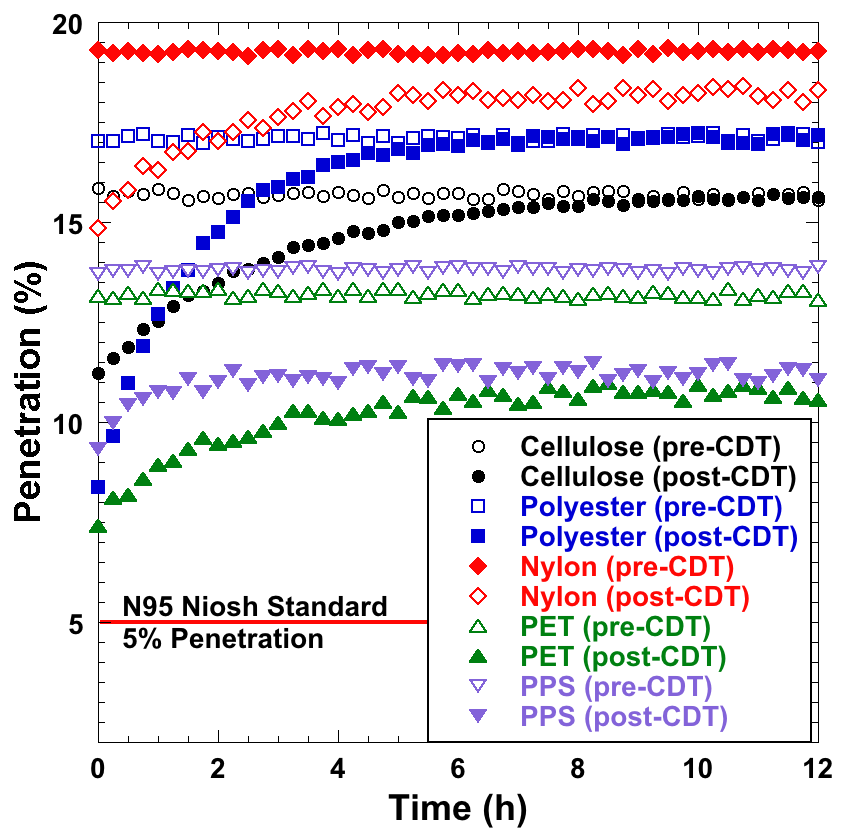
Figure 16 shows results of filtration tests (penetration vs. time) pre- and post-CDT treatment for knitted cloth FMs, which exhibit a different route to electrocharging, most likely via ion adsorption. Two observations are immediately apparent from the results. Firstly, whereas penetration values are steady (time-independent) for pre-CDT cloth FMs, post-CDT they show marked reduction in penetration (i.e. improvement in filtration efficiency) due to electrocharging. Although the penetration values do not meet the N95 standard, they do offer improved filtration protection to the larger populace that relies on cloth FMs for protection. The penetration values relax over hours and track the discharging of these fabrics. Secondly, whereas cellulose and polyester penetration values converge to an asymptotic value that matches their pre-CDT values, Nylon, PET, and PPS FMs relax to a lower penetration value, implying improved filtration efficiency even after the charges have desorbed from fabric surfaces. This observation is in perfect accord with results tabulated in Table 1, where Nylon, PET, and PPS are the only fabrics that relax to non-zero negative charge values. This behavior can only be attributed to the fact that there must be embedded dipoles in these three fabrics' constituents that are oriented to a limited extent during CDT. Whereas the adsorbed ions are lost over time, most likely from desorption, the embedded dipoles within the fabrics are sufficiently oriented, much like electret fabrics, to impose an electric field that improves filtration efficiency. Please note that we paid no attention to yarn thickness, fabric pre-treatment methods etc. which certain impact penetration values. For instance, the nylon fabric we employed in tests was quite coarse, which explains its high pre-CDT penetration percentage. Our aim here was to explore charge uptake ability for knitted cloth fabrics, its reliance on material parameters must await future investigations.
Conclusion
In summary, we have presented design principles to construct one's own Corona Discharge System from common parts such as microwave ovens and neon sign power supplies. We pinned down the operational parameters for the treatment method for polymeric fabrics (prone to melting) versus knitted cloth fabrics (prone to singeing). Charge and filtration tests show improved filtration efficiency with charge uptake. Whereas the non-woven, polymeric, eletret fabrics are electrocharged via the well known iosthermal charging mechanism, we proffer the informed speculation that knitted cloth fabrics most probably adsorb charges onto their surfaces, which are lost over time through desorption. The reduction in post-CDT cloth FM filtration efficiency tracks discharging of these fabrics, but this does not present an issue. Since CDT protocol takes only a few seconds, cloth FMs can be immediately re-charged and used for respiratory protection. Cloth FMs and Surgical Masks certainly do not provide N95 quality protection even with CDT treatment, but the improvement in filtration efficiency is still very good for use by the larger populace in non-critical settings such as hospitals and quarantine centers.
We close with three final remarks. Firstly, we are continuing a few final tests, which we will post here in coming weeks. Secondly, our CDT design can also be used for decontamination of FMs and FRs when the ground electrode is replaced with the positive terminal; the CDT system operates as a plasma generator in this mode and produces ozone for decontamination. Finally, in this plasma mode, this system's decontamination ability is not limited to just FRs and FMs, it can apply to any surface. We close with the earnest hope that the method is useful to people out there.
ACKNOWLEDGMENTS
The authors gratefully acknowledge help from Dr. Kieran Deasy and Mr. Makoto Kuroda from OIST Engineering Support Section for help with machining, Prof. Izumi Fukunaga with imaging pinhole burns, Prof. Pinaki Chakraborty and Dr. Julio M. Barros with thermal imaging, and Mr. Andrew Scott, Mr. Micheal Cooper, and Mr. Chris Wu, OIST Communication & Public Relations Division for help with video imaging and web editing.
Terms and conditions

This work is licensed under a Creative Commons Attribution-NonCommercial-ShareAlike 4.0 International License.
The work is © Okinawa Institute of Science and Technology 2020. It is being shared via the OIST group website under a Creative Commons Attribution-Non Commercial 4.0 International Public License.
Please note the terms and conditions set out in the license, and in particular note the License Conditions set out in Section 3 and the Disclaimer of Warranties set out in Section 5.