

Investigation of noise
ゴールデンウィーク posting continues. As promised a few months ago, I’m going to talk about some artefacts I’ve found while using an ESR electrolysis cell. This has no practical meaning at all and is meant only as a futile intellectual exercise into what kind of noises you can encounter while doing electrochemistry. Read more...
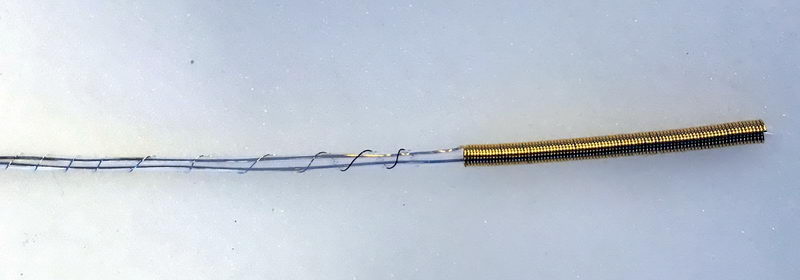
Above is a close-up of the electrolysis cell mentioned at the end of the “ESR installation” post from March this year, and this is a full view of the cell:
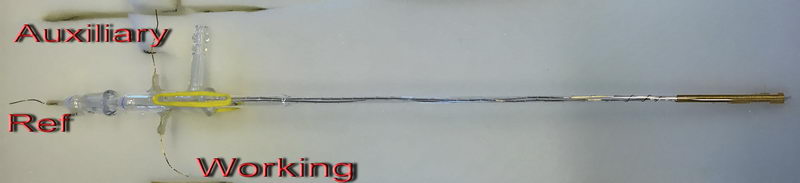
It is a 5 mm diameter quartz tube with gold working and auxiliary electrodes and a silver pseudo-reference electrode inserted inside. The working electrode is a coiled wire, and the auxiliary electrode is a wire inserted in a Teflon tube with small holes that goes inside working electrode coil. Reference electrode is a thin silver wire that coils around both electrodes protected by Teflon tubing. So the working electrode has a large area and it also shields any content that is inside the coil, so only the species generated between the quartz tube walls and coiled wire are detected in a thin layer.
While the cell is not designed for the CV and it is not how it’s meant to be used, since we use silver wire pseudo-reference and we also work with metal complexes that tend to overoxidize when the potential is too high, as a first trial, we usually attempt to obtain a CV in such a cell to roughly estimate the potential to use for electrolysis and to just have a better idea about what kind of process we are dealing with. That is what led to this whole investigation of the noise patterns, which you normally would not encounter in electrolysis due to its slower timescale compared to a CV.
As mentioned in the previous post, all CV’s, with or even without electroactive compound, came out with a lot of noise, which seemed a bit more complicated than just an electrical noise from 60 Hz AC.
Before going any further, I have to say that seeing electrical noise with 60 Hz frequency is very common in systems where you have a high resistance reference electrode, a solution with low conductivity or experiments at low temperature and also in the case of nearby electrical appliances that are not shielded by a Faraday cage. However, this 60 Hz noise looked quite simple, something like this at 500 mV/s scan rate (model system with a high resistance reference electrode):
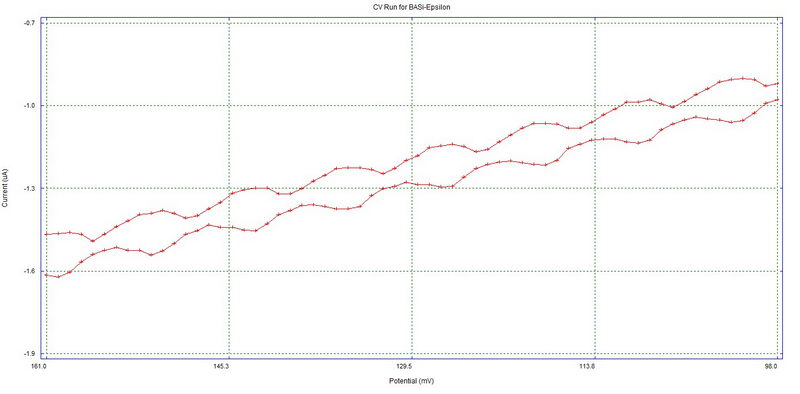
If we convert the X-axis to time instead of millivolts, by knowing that we used 500 mV/s scan rate in this example, we can get a value of 60 Hz for the noise. For example, going from 0.15V to 0.20V (50 mV difference) will take 0.1 second. In this range, we can see roughly 6 peaks (at least, in the lower curve), so this noise has a frequency of about 60 Hz.
Clearly, when putting an electrochemical cell inside a powerful magnet next to a large power supply, we should have expected to see the 60 Hz noise, but in fact, the baseline at 500 mV/s looked somewhat more complicated, indicating that something else is happening here:
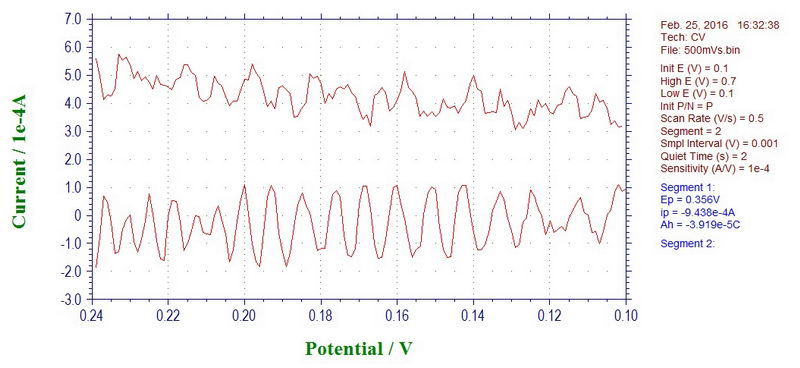
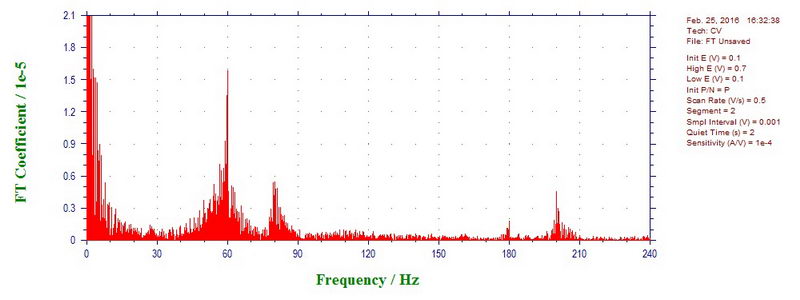
This can be easily confirmed by doing discrete Fourier transform of this data: there is definitely large contribution of 60 Hz, but also a little bit of 80, 180, and 200 (or 300) Hz:
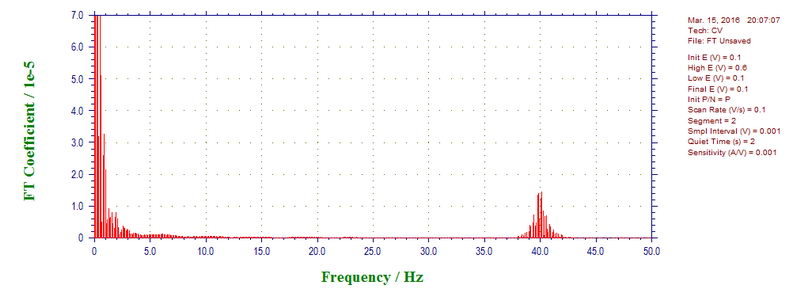
However, 500 mV/s with sampling every 1 mV is not the best scan rate to see higher frequency components. Any frequencies higher than the Nyquist frequency, which is ½ of sampling rate (500 points per second in this case) will be reflected back and appear as a difference. For example, the CV at 100 mV/s (sampling every 1 mV) shows major noise of 60 Hz, which appears as 40 Hz as a difference between 50 Hz (Nyquist frequency) and 60 Hz (10 Hz) reflected back from 50 Hz (50-10 = 40 Hz).
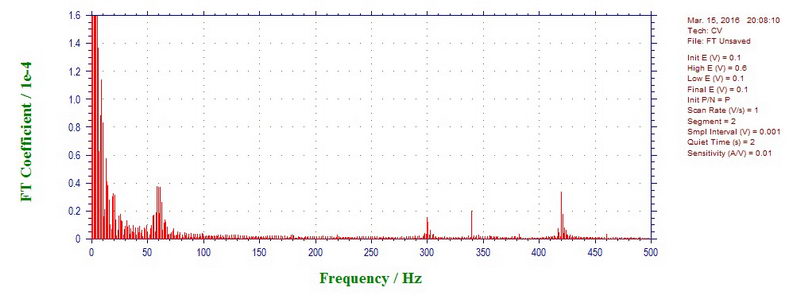
To see new components, higher scan rates were investigated, for example, 1000 mVs (microwave power off) shows components at 60, 300, 340, 420, 460 Hz (almost all of them are odd harmonics of 60 (60 times 5, 7 and 9 with 460 as a reflection of 540), except for 340 Hz):
At 1700 mV/s, microwave power on, the components are 60, 300, 420, 540, 660, 780 Hz (again, all odd harmonics of 60). So overall, going from 50 mV/s to 5 V/s, we see most commonly 10-11 Hz (fan?), 60 Hz, 180 Hz, 300 Hz, 340 Hz, 420 Hz, 540 Hz, 660 Hz, 780 Hz, 900 Hz, 1260 Hz etc, both with microwave off and on.

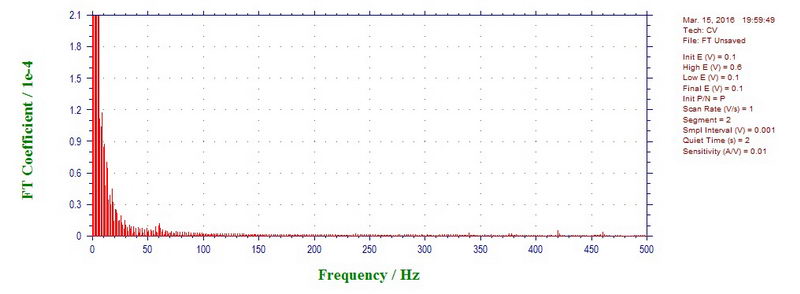
For comparison, 1000 mV/s CV outside the cavity is almost clean (small peak at 60 Hz):
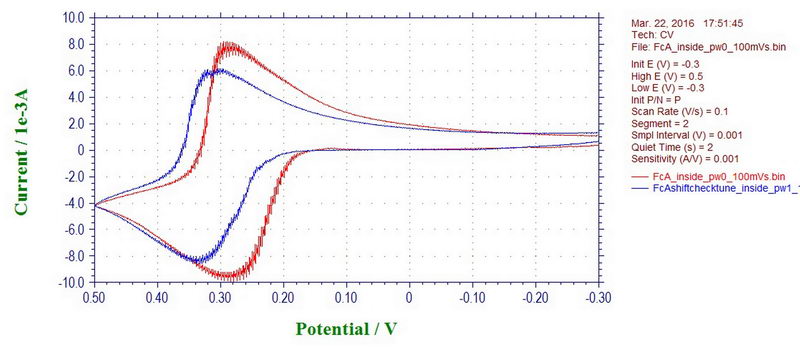
Interestingly, the peak potentials in the CV can also shift with a microwave power off or on, which will affect your measurement inside the cavity. But, again, this is only applicable to cyclic voltammetry at a fast scan rate; the effect disappears at slow scan rates (and will not affect electrolysis to a large extent). For example, this is ferrocene recorded inside the cavity with a microwave power on (blue line) and off (red line) at 100 mV/s (ferrocene in 0.1M TBAP/DCM):
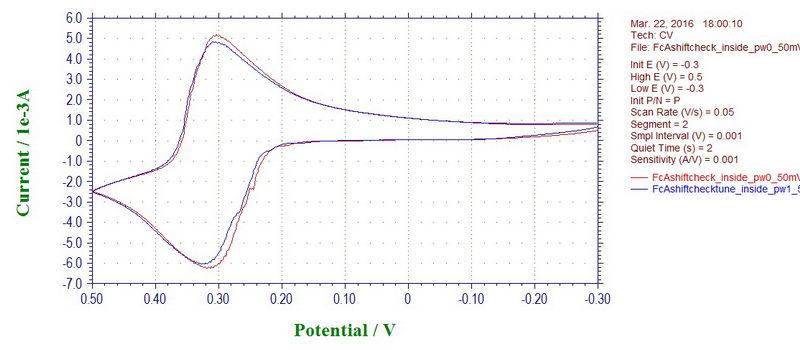
Although at 50 mV/s, the effect is not seen (almost too good, maybe there is some filter applied at slow rates):
In any case, as with most of the noise, the problem could be due the reference electrode that is prone to sensing various noises due to its location, or shape, or a bad contact. The reference electrode in this setup is a coiled wire that is not shielded in any way. We can check it by reconnecting the reference electrode cable to an auxiliary electrode that will now act as a reference electrode. Luckily, the auxiliary electrode is a wire that is inserted inside a coil of the working electrode which acts as a shield, so it's almost like a Faraday cage. Under these conditions, any noise disappears completely (ferrocene at 100 mV/s; red line with microwave on and blue line with microwave off):
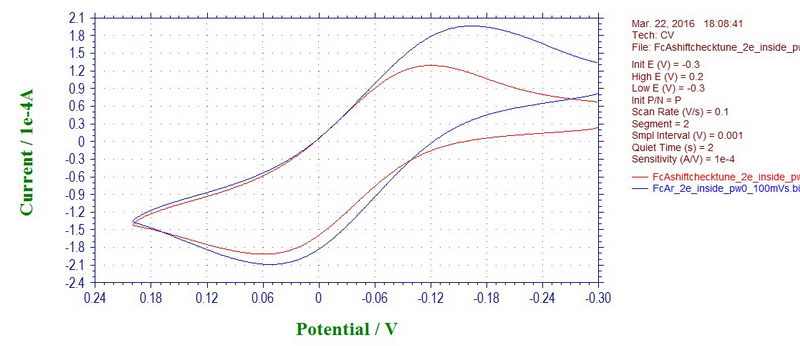
However, this comes at a price of having too much resistance on the auxiliary, small current, large peak-to-peak separation and a need for iR compensation (not done in the example above). The potential shift for ferrocene with microwave power on and off is not observed (not a clear case due to peak broadening, but it appears that way).
In any case, it is unlikely all this will cause too much trouble for an actual electrolysis experiment in this cell (where potential needs to be adjusted by finding the value at which some reasonable current starts going), but since I normally prefer to record a CV before electrolysis, this is something to be aware of, and it was a good chance to demonstrate what kind of noise you can sometimes see during electrochemical experiments and how to deal with it (use slower scan rate in this particular case). For actual CV experiments inside the cavity, if they are needed, the cell needs to be designed in a slightly different way (and these experiments give some idea of how the cell should be set up), but we’ll consider it when it becomes necessary.