

FY2013 Annual Report
Physics and Biology Unit
Associate Professor Jonathan Miller
Featured in special issue of Computational Biology and Chemistry: Complexity in Genomes, 2014
Abstract
To a first approximation, the opposing forces of neutral variation and selection for function drive evolution; in the context of genomics, sequence variations are filtered by their impact on fitness. In practice, these effects are measured by evaluating whether observed sequence similarity exceeds or falls short of the neutral prediction, given time elapsed since divergence from a common ancestor.
It doesn't diminish the importance and effectiveness of more sophisticated methods to say that stripped to their basic components, measures of sequence similarity depend on assessing whether observed length and quality of sequence matches exceed frequencies expected on a neutral or null model that most often consists of random, site-independent point mutations. Such point mutations include base substitutions and short indels, the most common mutation events.
On such a null model, the frequency of similar sequence elements decays exponentially with element length, where the coefficient of length in the exponent is inversely proportional to the mean rate of mutation per base. Elaborations on such null models tend to alter the values of this mean rate, but not the exponential form of the decay. Although it is well appreciated that the mutation rate varies with location within the genome, it is rarely if ever possible to deconvolute the neutral component of this local variability from a potential selective contribution. There exists so far no systematic, genome-wide prediction or characterization of this rate variation.
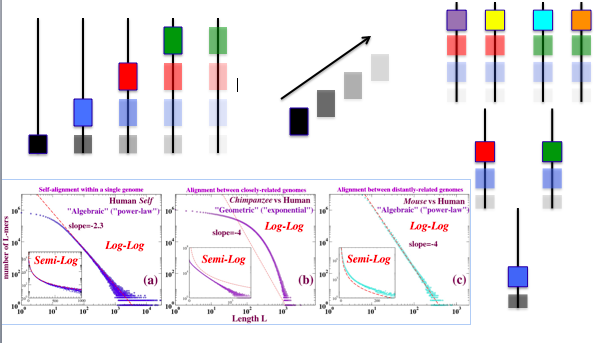
To our awareness, systematic deviations from the exponential were first demonstrated in 2006, where an empirical algebraic form was found to be typical of sufficiently distant species pairs. Although subsequent genome-wide experiments seem to have validated the conjectured limitations of an exponential null model, the algebraic form remains unexplained.
Over the last few years we elucidated a qualitatively similar algebraic character of the length distributions of duplications – by which we mean here, identical sequences within a single genome - to which much of the earlier discussion in this section about neutral evolution and selection also applies. We pursued this observation in the hope that its origins could illuminate the origin of the algebraic character of the conserved sequence distribution. Very recently, a simple explanation for the algebraic form of the duplication length distribution has emerged - one that we believe may provide insight into the failure of the exponential null model and some clues about how to resolve it.
1. Staff
- Professor Miller, PI
- Dr. Eddy Taillefer, Group Leader
- Dr. Kun Gao, Researcher
- Dr. Zdenek Lajbner, JSPS Post-Doctoral Fellow
- Dr. Sathish Venkatesan, Researcher (until April 2013)
- Dr. Federico Manna, Researcher (until December 2013)
- Dr. Maxim Koroteev (until December 2013)
- Quoc Viet Ha, Technician
- Midori Tanahara, Research Administrator
2. Collaborations
- Theme: Neuroscience
- Type of collaboration: Joint research
- Researchers:
- Professor Gordon Arbuthnott, OIST
- Dr. Marianela Garcia Munoz (Arbuthnott Unit, OIST)
- Dr. Reuven Pnini (Hikami Unit, OIST)
3. Activities and Findings.
3.1 Algebraic distribution.
Within a single genome sequence, as for pairwise genome alignment, long stretches of identical sequence are improbable within a random, site-independent point mutation model; however, within a single genome long duplications are known to occur with a high frequency via a number of well-characterized mechanisms. Apart from context and epigenetics, a newly created duplication is redundant and may suffer reduced constraint, so that it is free through subsequent mutations to degenerate or to adopt new functions. In this respect, a duplication event is analogous to a speciation event.
As we have done in the past for pairs of genomes, within a single genome we investigated runs of bases identical modulo a number of hierarchical matching criteria. We first characterized self-alignments over a broad range of organisms. Because sequence alignment is heuristic and only algorithmically defined, it was essential to confirm the qualitative features of the alignments by intersections, whose outcome can be defined independently of any algorithm. We developed novel suffix-array based intersection (or k-mer) methodsand an associated software package for this purpose [Taillefer and Miller, 2014] , advances over existing methods such as Mummer including the speed with which whole mammallian genomes can be processed as a single text string, and the implementaion of classification of maxmer nesting.
An approximately algebraic decay of duplication lengths, with an exponent close to -3 is a common feature of duplicated sequence length distributions from natural genome assemblies; although it is not universal, its straightness of the line tends to improve as newer assembly versions of a given genome sequence are released suggesting that it is not an artifact.
Figure 1: Duplication length distributions computed by self-intersection of: (brown) human chromosome 3 (repeat-masked); (orange) Grapevine chromosome 6 (no repeat-masking); (blue and green) simulated chromosomes at steady stage of copy/substitute models for duplication dynamics. One should read “maxmer” in this context as “exact duplicate," or - technically - "supermaxmer."
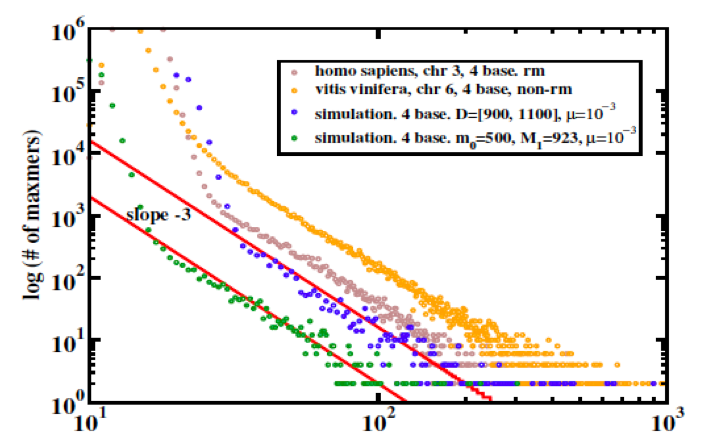
Duplications pose significant challenges to genome assembly, and many genome assemblies may not be so reliable to begin with; nevertheless, it seems fair to say that lines this straight should never be observed in natural data sets unless there is a good reason for them.
3.2 Models
We’re aware of two manuscripts that describe plausible origins of the algebraic decay and -3 exponent [Massip 2013] and [Koroteev 2013]. The standard for plausibility is that the -3 emerges without any need to fine-tune model parameters. Both [Massip 2013] and [Koroteev 2013] map sequence duplication onto a polymer fragmentation model; [Koroteev 2013] further explain the limits of applicability of this mapping and demonstrate a model that applies even when the mapping to polymer fragmentation fails.
Figure 2: Duplicate sequence length distributions from copy/substitute models of duplication dynamics [5] plus random base substitution at rate mu per base per time step, compared to analytic steady-state solutions of the dynamic equations for monoscale source . “Maxmer” and “supermaxmer” should in this context be read as “exact duplicate.”
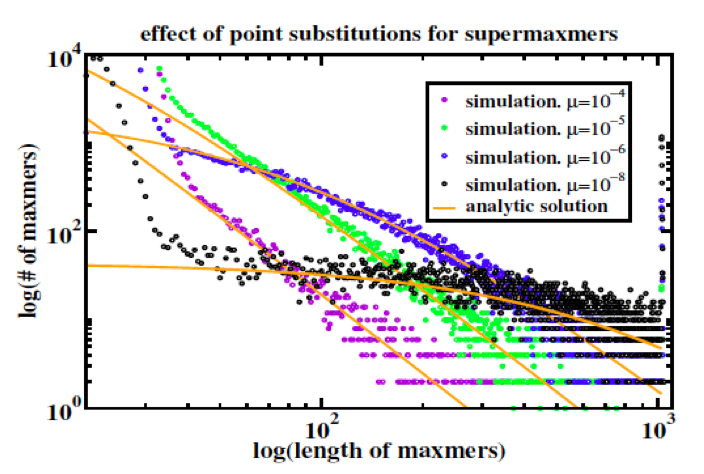
As explained in [Koroteev 2013], the validity of the mapping of sequence duplication to polymer fragmentation requires that the characteristic time for overwriting long duplications by new duplications exceed the time over which point mutations break long duplications into short duplications; this is the collisionless regime referred to above, and represents a constraint on the source of duplications by setting the cross section for overlap. Collisions occur when a new duplication overwrites an existing long duplication; overlap is not meaningful in the context of polymer fragmentation and is unnatural within a polymer fragmentation model. Figure 2 demonstrates that their model, which incorporates coupling coefficients that are inconsistent with polymer fragmentation, quantitatively recapitulates the crossover from the collisionless regime to a regime where new duplications overwrite existing long duplications.
In the discussion above it is easy to lose sight of the -3, which arises within the polymer fragmentation model in a simple and natural way: each polymer fragment freshly generated by the external source is broken down [ by point mutation ] into subfragments with lengths l exponentially (Poisson) distributed ~ exp(-lambda*l) where lambda, the inverse mean subfragment length, is directly proportional (c.f. constant mutation rate) to the time elapsed since the fresh polymer fragment was generated. Accounting for monomer conservation with the appropriate normalization and integrating over time yields a steady-state length distribution ~ C/l3.
3.3 Orthology and paralogy
The set of exactly matching sequences in a chromosomal self-alignment consists of two components: (i) duplicated (or multi-copy) sequences; and (ii) the remainder, single-copy sequences. Single-copy sequence alignments are found, by definition, strictly on the diagonal of a dot-plot; adapting customary blastZ nomenclature, we refer to such alignments as “self hits,” or ASH, where the “A” stands for “ancestral” and is explained below. Duplicate sequence alignments can appear anywhere on the dot plot; they include a trivial self-hit (accounting for inverted duplications is straightforward), together with off-diagonal matches that we call “non-self hits” (NSH). The NSH yield the -3 power algebraic length distribution.
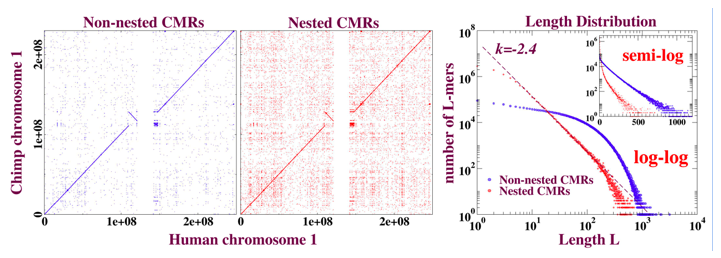
Motivated by these observations, we can now describe a distinct, simpler, and local way of extracting the exponential and algebraic components from the “Raw” as ASH and NSH respectively that illuminates the evolution of these sequences. The outcome of our separation is illustrated in figure 3.
Figure 3: Dot plots and length distributions of CMRs (exact matches) from blastZ Raw alignment of human and chimp chromosome 1. The purely local property of “nesting,” discussed in the text, is sufficient to separate the exponential (ASH) from the algebraic (NSH) components of the length distribution. The dot plots demonstrate that nesting is not just a matter of whether the aligned match appears on- or off- diagonal. The deviation from power-law evident in the tail of the length distribution in red can be accounted for by random mutation subsequent to the human-chimp divergence that has cut longer NSH into shorter NSH.
(i) Nested and non-nested matches.
We eventually identified several different methods of achieving this separation. Of these methods, most are not fully local; like the chaining and netting stages of blastZ, they make essential use of global information; however, we have been able to show that local properties of an exact match and its immediate neighborhood, independent of the rest of the genome, are sufficient to separate the algebraic from the exponential component.
Figure 4: Definition of nested and non-nested matches. “CMR” denotes “contiguously matching runs (of bases),” which are obtained in practice from blastZ Raw, and for present purposes are simply exactly matching sequences. The figure illustrates duplication (hg seq3, the child) of a subsequence common to both human and chimp (hg seq1 and pt seq1, the parents), subsequent to their divergence. The duplication transfers hg seq2, a subsequence of hg seq1 and pt seq1 to a new sequence context, labeled hg seq3. Provided minimal further changes occur to the parents subsequent to divergence, the child (a “nested-CMR”) remains a proper subsequence of (“nested in”) its parents. The non-nesting of the parents in this example must be confirmed by checking all aligned sequences, genome-wide.
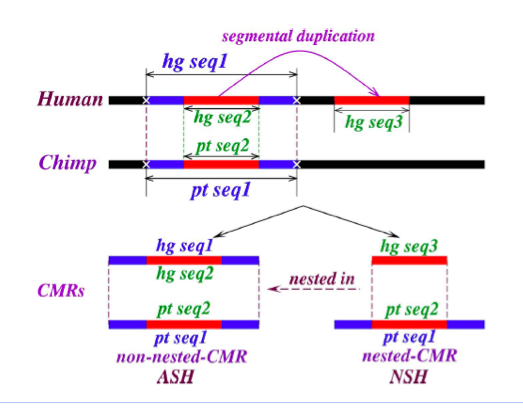
Our method is illustrated in figure 4, where a subfragment of orthologous sequence in human and chimp is copied subsequent to the branching of the species. If we make an assumption of negligible further mutation in these regions subsequent to branching, it is obvious that the altered sequence context of the new copy ensures that it is just a subsequence of a longer (parent) exact match, so that we say it is “nested” into the parent; having no cognate in chimp, it must be an NSH. The parent, consisting of orthologous sequence, constitutes a self-hit in the ancestor, e.g. before branching; hence it is an ASH.
The effectiveness of this classification in separating the algebraic from exponential is evident in figure 3, which also suggests that the classification does not simply reduce to “diagonal” or “off-diagonal.” Although not shown here, the separation tracks the blastZ Net and Raw minus Net curves in figure 3 well as evolutionary distances increase, and even when the “algebraic” versus “exponential” character of the NSH and ASH no longer applies.
(ii) Relationship to orthology and paralogy.
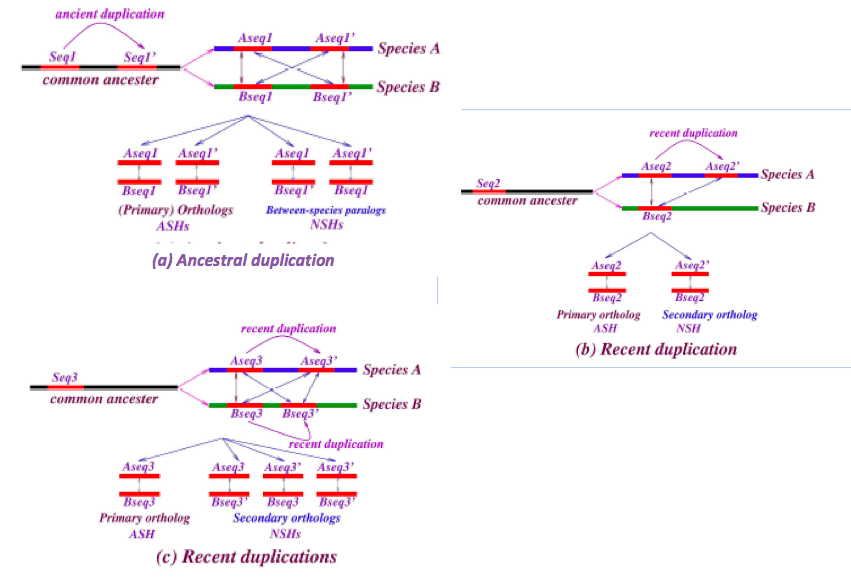
The notions of primary and secondary ortholog that we invoke here follow those described by [Han 2009] who used them to address genes based on their synteny. Here we apply these notions to address sequences that may or may not be genes, and “synteny” refers solely to the local sequence context – it does not involve relative order of long series of genes. Figure 5 illustrates some sequence histories, how they correspond to primary and secondary orthologs, and between-species paralogs, and their mapping to ASH and NSH can be inferred along the lines of figure 4.
Figure 5: Relationships of primary and secondary orthology to ASH and NSH. Examples of chronologies of duplication and how they are reflected in the ASH and NSH classification. Each schematic (a,b,c) can be understood in terms of nesting, as in figure 4.
(iii) Empirical comparison of the NSH/ASH classification of protein-coding genes to existing genome-wide homology databases.
We find strong concordance of a procedure in which we classify protein-coding genes as primary orthologs in human/chimp and human/mouse on the fraction of their subsequences that are represented by non-nested CMRs, with existing on-line homology databases. Orthologous protein-coding regions show an exponential distribution of shared matching sequence; alignment of a chimpanzee (say) gene to the complement of its orthologous sequence in human, yields an algebraic distribution of exactly matching sequence lengths, with exponent -3. Details may be found in [Gao 2014].
References:
[Taillefer 2014] E Taillefer and J Miller. Exhaustive computation of exact duplications via super and non-nested local maximal repeats. J Bioinform Comput Biol., 12(1)(1350018), 2014.
[Massip 2013] F Massip and PF Arndt. Neutral evolution of duplicated DNA: An evolutionary stick-breaking process causes scale-invariant behavior. Physical Review Letters, 110(148101), 2013.
[Koroteev 2013] MV Koroteev and J Miller. Fragmentation dynamics of dna sequence duplications. arXiv: 1304.1409v3 [math-ph], 2013.
[Han 2009] MV Han, JP Demuth, CL McGrath, C Casola, and MW Hahn. Adaptive evolution of young gene duplicates in mammals. Genome Research, 19:859-867, 2009.
[Gao 2014] K Gao, K and J Miller (2014). Ortholog exponentials and power-law paralogs. Computational Biology and Chemistry, special issue; in press.
4. Publications
4.1 Journals
- Taillefer, E. and J. Miller (2014). "Exhaustive computation of exact duplications via super and non-nested local maximal repeats." J Bioinform Comput Biol 12(1): 1350018.
4.2 Books and Other One-Time Publications
- Ha, Q. and E. Taillefer (2013). REPROWSER: a genomic maximal repeat length distribution browser. http://pb.unit.oist.jp/index.html, online. (computer program)
- Taillefer, E., et al. (2013). REPROWSER: a genomic maximal repeat length distribution browser. http://pb.unit.oist.jp/index.html, online. (online database)
4.3 Oral and Poster Presentations
- Gao, K. and J. Miller (2013). Genome sequence evolution: ortholog exponentials and paralog power laws. OIST Internal Seminars, Okinawa JAPAN.
- Koroteev, M. (2013). Fragmentation dynamics of duplications and point mutations in whole genome sequences. OIST internal seminar, Okinawa JAPAN.
- Koroteev, M. (2013). Fragmentation dynamics of duplications and point mutations in whole genome sequences. IST Austria.
- Lajbner, Z. (2013). JSPS Science Dialogue lecture "From fish to mitochondria". Kumamoto Prefectural Daini High School.
- Gao, K. and J. Miller (2014). Ortholog exponentials and paralog power-laws. The Second Annual Winter Q-bio Meeting. Kona, Hawaii, USA. (poster)
- Koroteev, M. and J. Miller (2013). Exact dynamics of duplications and mutations in whole genome sequences. ISMB/ECCB 2013. ICC Berlin, Germany. (poster)
- Koroteev, M. and J. Miller (2013). Exact dynamics of duplications and mutations in whole genome sequences. MCCMB2013. Moscow State University. (poster)
- Taillefer, E. and J. Miller (2013). REPROWSER: a genomic maximal repeat length distribution browser. 7th Asian Young Researchers Conference on Computational and Omics Biology (AYRCOB2013). Computational Biology Research Center (CBRC), Tokyo. (poster)
5. Intellectual Property Rights and Other Specific Achievements
Nothing to report
6. Meetings and Events
Nothing to report.
7. Others
Nothing to report.